Palouse Growing Season Planner
Growing degree days and frost risk for Moscow, Idaho
Turn a century of Moscow weather records into planting decisions: accumulate growing degree days for Palouse crops, see last-spring and first-fall frost odds, and compare any year with the normal.
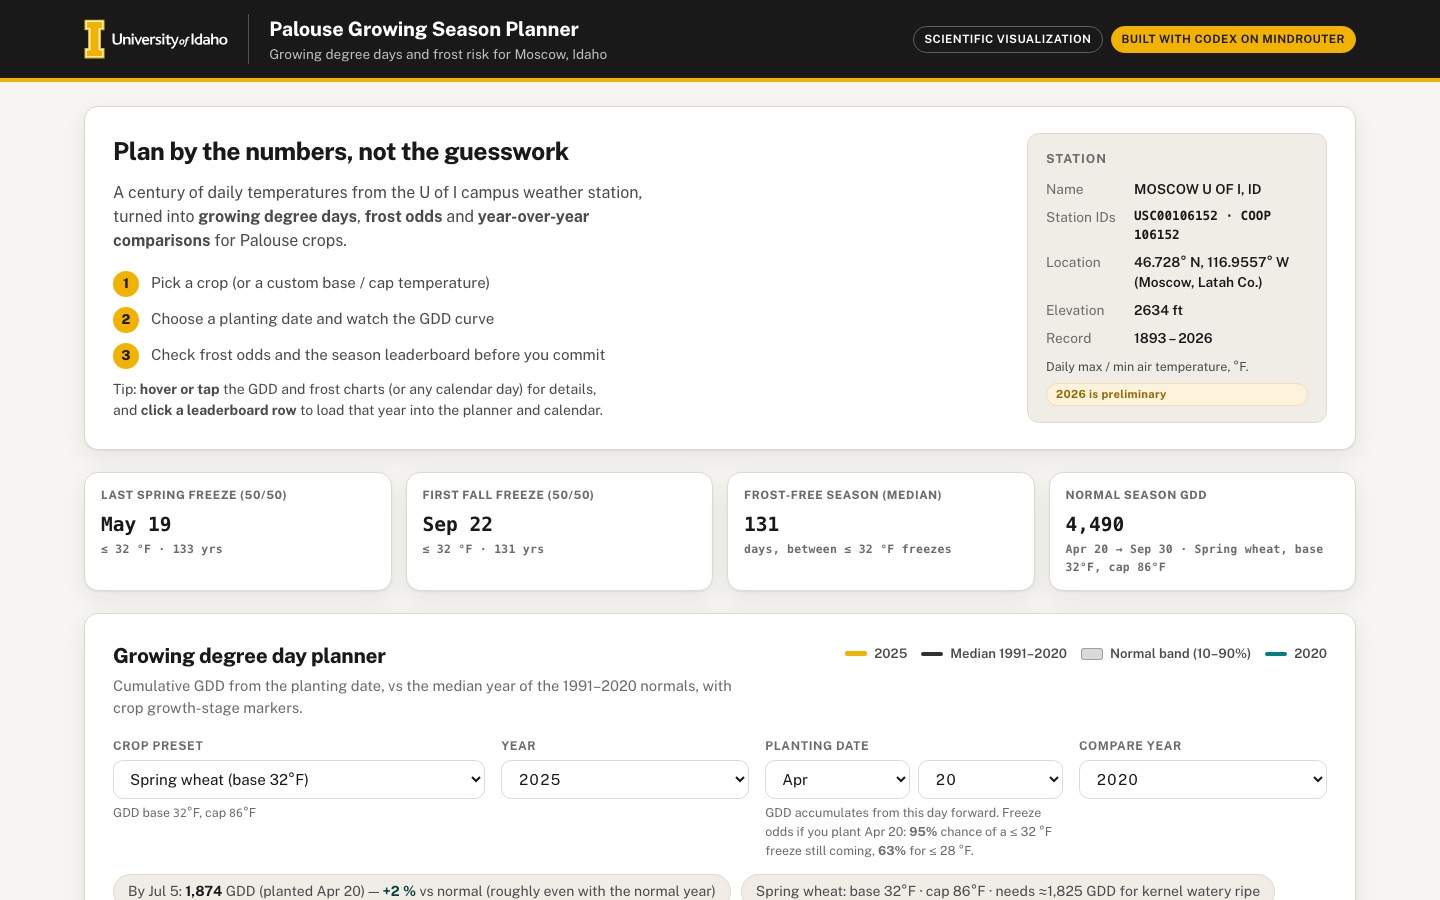 Desktop · click to enlarge
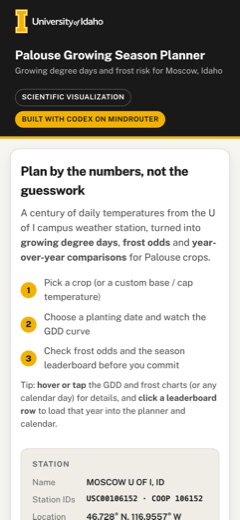
What it is ✎ blurb written by the AI critic
Explore 133 years of daily temperatures from the University of Idaho campus weather station in Moscow. Pick a Palouse crop and planting date to see growing degree days build up against the 1991–2020 normal, with the date each growth stage is reached. You can also check the odds of a late spring or early fall freeze, and browse a daily temperature-anomaly calendar and the warmest and coldest seasons on record.
Try this
- Choose Sweet corn, set Year to 2015 and Compare year to 2019, and see how much earlier a hot summer reaches silking and harvest.
- In the frost chart, switch to ≤ 28 °F and toggle between Full record and 1991–2020 to see how the median freeze dates move and how they compare with NOAA's official ◇ markers.
- In the Season leaderboard, open Cold season and click the harshest winter to load that year into the planner and the anomaly calendar.
Highlights ✎ written by the AI critic
- Growing degree day planner for six Palouse crops plus a custom base/cap, drawn against the 1991–2020 median and 10–90% band, with growth-stage dates
- Freeze-risk curves at ≤ 32 °F and ≤ 28 °F from the full 1893–2026 record or from 1991–2020, with NOAA's official freeze dates for comparison
- Calendar heatmap of daily temperature anomalies for any year since 1894
- Leaderboards of warmest and coldest years, growing seasons and winters; click a row to load that year
- CSV export of season statistics and of the current GDD curve, with NOAA ACIS and NCEI sources cited in the app
Who it's for
Plant sciences, CALS Extension, community gardeners, farm managers
Features
- Crop presets with their base temperatures (spring wheat, dry peas, lentils, canola, sweet corn, potatoes) and a custom base/cap
- Planting-date picker → cumulative GDD curve for the chosen year vs the 30-year normal band, with crop growth-stage markers
- Frost probability chart: probability of a ≤32°F / ≤28°F freeze after each spring date and before each fall date, from the full record
- Calendar heatmap of daily temperature anomalies for a selected year
- Warmest/coldest seasons leaderboard and a CSV export
- Source/citation panel
Data & sources
- data.rcc-acis.org — NOAA RCC-ACIS StnData web service (POST
- NOAA RCC-ACIS StnData: same station, 1950-01-01 to 2026-09-12 subset, and the full record with flags and observation times.
- data.rcc-acis.org — NOAA RCC-ACIS StnMeta (
- www.ncei.noaa.gov — NOAA NCEI 1991–2020 U.S. Climate Normals, daily normals for USC00106152 (
- www.ncei.noaa.gov — NOAA NCEI 1991–2020 U.S. Climate Normals, annual/seasonal normals including freeze-date probabilities (
- Crop references cited in the app: NDAWN wheat and canola GDD help pages (NDSU), the University of Delaware Extension sweet-corn GDD note, and the ScienceDirect (2025) review of GDD base and upper temperature thresholds.
How it was built
Written by Codex CLI 0.154.0 (github.com) on qwen/qwen3.8-27b, served by MindRouter, the University of Idaho's on-premises AI platform.
Rounds by kind
| build | 1 |
| feedback | 5 |
| continue | 3 |
| critic | 2 |
Lines of code per file
| body html | 198 |
| app css | 325 |
| app js | 1,244 |
| scripts | 391 |
Critic scores ✎ scored by the independent AI critic, 1–10
Independent audits ✎ by the AI critic
Automated checks
Checked by critic-verify.
Data spot checks ✎ written by the AI critic
- Calendar tooltip 2025 Jul 15: Tmax 89 F, Tmin 54 F, anomaly +5.4 F. Raw ACIS row [2025-07-15, 89, 54]; independent 7-day-smoothed 1991-2020 normal 66.09 F gives +5.4. MATCH
- Frost KPIs and markers (<=32 F, full record): median last spring freeze May 19, first fall freeze Sep 22, frost-free 131 days, 90%/10% at Apr 27/Jun 12 (spring) and Sep 6/Oct 18 (fall), 133 spring / 131 fall years. Independent Python recompute from the raw file gives the same. MATCH (fall eligibility was fixed in round 10)
- 1991-2020 <=28 F toggle: median May 4 / Sep 28, frost-free 149 days. Independent recompute May 4 / Sep 28 / 149. MATCH (the Data & sources text previously said May 5 / Sep 29; fixed)
- Leaderboard warm season (Apr 1-Oct 31): 1958 60.4 F, 2015 59.8, 1936 59.7. Winters (Nov 1-Mar 31): mildest 1933-34 41.3 F, harshest 1916-17 27.7 F. Independent recompute is identical. MISMATCH before the critic rounds: the app used Apr 2-Sep 30 and same-calendar-year Jan-Mar+Oct-Dec, so it showed '1934-35 42.5 F' and '1985-86 28.9 F'. Fixed in round 10
- Leaderboard annual GDD 32-86 (clipped formula): 1934 7,231; coldest 1916 5,386. Independent recompute 7,230.5 / 5,386. MATCH
Round-by-round timeline
Every harness round, in order. The prompts and FEEDBACK.md were written by the AI reviewer; the app code was written by the harness. Expand a round to see the exact prompt and the FEEDBACK.md the harness received.
-
Season leaderboard is broken. Under the "GDD 32–86 / Mean temp / Warm season / Cold season" tabs the card shows the literal text
[object HTMLHeadingElement],[object HTMLTableElement]twice instead of the two tables, for every tab (clicking tabs changes nothing visible). Expected: two ranked tables (Warmest / Coldest), ideally top 10, each row with rank, year, value and a small inline bar; hovering a row highlights it and clicking a row loads that year into the GDD planner and the anomaly calendar. -
Anomaly calendar does not meet the spec, and its layout is broken. SPEC: "Calendar heatmap of daily temperature anomalies for a selected year." Current: there is no year control; it shows a 1991–2025 day-of-year average; and all 365 cells are drawn on top of each other inside the January block (only ~5 rows of 7 squares are visible under JAN/FEB; the MAR…DEC labels have no cells under them), leaving ~300 px of empty white card. Expected:
-
a year selector (default 2025; every year in the embedded daily data; 2026 marked preliminary);
-
each cell = that day's mean temperature ((Tmax+Tmin)/2) minus the 1991–2020 normal for that calendar day (a smoothed day-of-year normal is fine);
-
a real calendar layout: either a GitHub-style grid (weeks as columns, weekdays as rows, month labels on top) or 12 mini month calendars (4×3 on desktop, 2 columns on phone), with every day in its correct place;
-
missing days shown as light hatched/grey "no data" cells;
-
a diverging colour scale centred on 0 (teal family below normal, near-white at 0, gold → brown above normal), with a single legend bar labelled e.g. −15 °F … 0 … +15 °F (the current legend is two separate bars and the cool bar runs teal → cream → brown, which is confusing);
-
tooltip with date, Tmax, Tmin, daily mean, normal and anomaly; and a one-line summary such as "2025: 214 days warmer than normal, mean anomaly +1.8 °F".
-
-
Frost-probability curves are truncated and therefore wrong. I recomputed from
data/raw/acis_stndata_USC00106152_maxt_mint_por.json(years 1894–2025 with ≤ 20 missing days in each half-year; last spring freeze = last day with Tmin ≤ threshold from Jan 1–Jun 30, first fall freeze = first such day from Jul 1–Dec 31):-
≤ 32 °F: P(last spring freeze on/after May 31) ≈ 23 % and on/after Jun 10 ≈ 12 %. The app shows 3 % at May 31 and the spring curve stops at May 31 (it drops to 0 at June 1). Moscow gets 32 °F freezes well into June.
-
≤ 32 °F: first fall freeze by Sep 1 ≈ 7 % of years (some freezes come in August). The app's fall curve only starts at Sep 1 and shows ~1 % there.
-
Reference values I got (≤ 32 °F): median last spring freeze ≈ May 19, 10 % chance of one after ≈ Jun 11; median first fall freeze ≈ Sep 22, 10 % chance before ≈ Sep 6, 90 % by ≈ Oct 19. (≤ 28 °F): median last spring ≈ Apr 27; median first fall ≈ Oct 12. Expected: spring curve = share of years whose last spring freeze falls on or after each date, computed through June 30 (reaching ~0 at the end of June); fall curve = share of years whose first fall freeze falls on or before each date, starting Jul 1. Show both on a Mar 1 – Nov 30 axis.
-
-
Frost readouts and labels are wrong / overlapping. For both thresholds the chips say "50/50 first fall freeze: Sep 1st" and "By Sep 1st, a freeze has occurred in 90% of years", and the "50% first freeze Sep 1" dot floats at the 50 % line above a curve that is at 0 % on Sep 1. The ≤ 32 °F 50 % crossing is really ~Sep 22 and 90 % is ~Oct 19. Also the in-chart legend text "— spring (risk still alive) — fall (freeze already in)" at the top-right overlaps the fall curve where it sits at 100 %, and its dashes are not coloured like the lines. Expected: correct 10 % / 50 % / 90 % markers on both curves (dots + labels that don't collide), a proper legend with coloured swatches outside the plot, and readout chips for median last spring freeze, median first fall freeze and median frost-free season length (days) for the chosen threshold.
-
The GDD "normal" is computed from Jan 1, not from the planting date, and it is a line, not a band. With spring wheat planted Apr 20 the dashed normal is already ~800 GDD on the planting day while the selected-year curve starts at 0, so the readout "2025 reaches 6,072 GDD by Dec 31 — −75 vs normal" compares different things. The footnote says "30-year normal accumulation from the same planting date", which is not what is drawn. SPEC asks for a 30-year normal band. Also, the normal disappears completely for a custom cap (e.g. base 41, cap 80), and other bases use a straight-line interpolation between base 32 and base 50. Expected: for the current base, cap and planting day, accumulate GDD for each year 1991–2020 from that same planting day, then draw the median (or mean) as a line and a shaded band (e.g. 10th–90th percentile; optionally a lighter min–max band). This works for every preset and every custom base/cap. Readouts should compare the selected year with the normal on the same date (e.g. "By Aug 1: 2,380 GDD, 6 % ahead of normal (≈ 4 days early)"), and for 2026 use its last reported date (Sep 7), not Dec 31.
-
Crop base temperatures and growth-stage thresholds are agronomically implausible. Spring wheat (base 32 °F) shows Tillering 150 / Jointing 400 / Heading 600 / Maturity 750, so from an Apr 20 planting it "matures" in late May; sweet corn "Harvest · 800" is reached in mid-July; lentils, canola and potatoes all use base 50 °F. For a Palouse spring planting, heading and flowering should land around late June–July and maturity/harvest around late July–September. Public extension references (approximate; please label stage markers as approximate planning values and cite the sources in Data & sources):
-
Spring wheat: base 32 °F. NDAWN (NDSU) wheat model: ~180 °F-GDD from planting to emergence, then ~143 GDD per Haun leaf stage (Haun 2 ≈ 395 GDD; Haun 10, about heading ≈ 1,540 GDD); physiological maturity is later still (roughly 2,000+). https://ndawn.ndsu.nodak.edu/help-wheat-growing-degree-days.html
-
Canola: base 41 °F (5 °C). NDAWN canola table (°F-GDD from planting): rosette 257–727, bud 728–932, early flower 933–1,165, late flower 1,166–1,397, ripening 1,398–1,874, ripe > 1,874. https://ndawn.ndsu.nodak.edu/help-canola-growing-degree-days.html
-
Sweet corn: base 50 °F, cap 86 °F; maturity depends on variety, typically on the order of 1,300–1,600 GDD, with harvest about 18–21 days after silking. https://sites.udel.edu/weeklycropupdate/?p=17630 (University of Delaware Extension)
-
Dry peas: base about 40–41 °F (4.5–5 °C); lentils: base about 32–36 °F (0–2 °C), per the base-temperature review at https://www.sciencedirect.com/science/article/pii/S037837742500469X
-
Potatoes: a base of 45 °F (7 °C) is commonly used. For peas, lentils and potatoes choose conservative, clearly-approximate stage values whose dates fall in a sensible season (flowering/tuber initiation in June–July, maturity in late July–September for an April–May planting). Also add, under the chart, a small stage timeline/table: for each stage, the date the selected year reached it and the date the normal (median) reaches it (e.g. "Heading · Jul 2 (normal Jul 6)"); "not reached" if it never is.
-
-
Stage labels overlap. At 1440 px the wheat labels "Maturity · 750", "Heading · 600", "Jointing · 400", "Tillering · 150" are stacked on top of each other at the right edge of the GDD chart; at 390 px they are an illegible blob. Expected: labels that never overlap (spread them out or put them on the curve), readable at phone width.
-
Planting date, year and axis are confusing. The planting date is a full date input (04/20/2025) but its year is ignored — after changing Year to 2008 the input still shows 2025. The chart marker says "plant Apr 21" while the input says 04/20 (off by one day). The x-axis runs Jan–Dec with a long flat line at 0 before planting and after October. Expected: a planting picker whose shown date always matches the selected year (or a month/day picker), a marker label that matches the input exactly, and an x-axis focused on the growing season (e.g. Mar 1 – Nov 30). Next to the planting date, show "Chance of a ≤ 32 °F / ≤ 28 °F freeze after this date" from the frost analysis — that ties the frost chart to the planting decision.
-
Phone (390 px): the page scrolls sideways by 168 px. The intro card is wider than the screen (its right edge is at 558 px) and its heading and paragraph are cut off ("Plan by the numbers, not the guessw…", "A century of daily temperatures from the U of I c…"). Expected: no horizontal scrolling at 390 px or 380 px; every card, chart, legend, segmented control and table fits (a wide calendar may scroll inside its own box, but the page must not).
-
CSV export freeze columns are meaningless. Almost every row has
first_32f_freeze=01-01andlast_32f_freeze=12-31(e.g.2025,365,6793,2247,49.9,60.9,39,01-01,12-31,no) — the first/last freeze of the calendar year. The leaderboard's "Season range" column repeats this ("last 32°F 12-31"). Expected columns: year, days with data, missing days, GDD columns with base/cap in the header, mean temp, warm/cold season means, last spring freeze ≤ 32 °F and ≤ 28 °F (before Jul 1), first fall freeze ≤ 32 °F and ≤ 28 °F (from Jul 1), frost-free days, preliminary flag. A second button that exports the currently shown GDD curve (date, selected-year cumulative GDD, normal median, band low/high) would make it more useful. -
Make it feel alive and give a headline. Charts swap instantly with no transition. Expected: short (200–300 ms) transitions when crop, year, planting date or threshold change (e.g. line draw-in / cross-fade, animated band), and a row of KPI tiles near the top computed from the data (median last spring freeze, median first fall freeze, median frost-free days, normal season GDD for the selected crop) that update with the controls.
-
Tooltips don't work on touch. On a phone, tapping the GDD chart, frost chart or a calendar cell shows nothing. Expected: tap (pointer events) shows the same tooltip as hover, and the tooltip stays inside the screen.
-
Data & sources. Add the crop base-temperature / stage references you use (item 6), and state how the normal band and freeze probabilities are computed (years used, data-completeness rule). Optional but nice: show NOAA NCEI's official 1991–2020 ≤ 28 °F spring/fall freeze dates (10/50/90 %, from
data/raw/ncei_normals_annualseasonal_1991-2020_USC00106152.csv, see SOURCES.md for how to read them) as small comparison ticks on the 28 °F frost chart, labelled "NOAA 1991–2020". -
Season leaderboard is STILL broken (not fixed in round 2). The card still shows the literal text
[object HTMLHeadingElement],[object HTMLTableElement]twice, for every tab. The two column containers are created with an array of elements passed where HTML text is expected, so the array gets stringified. Expected: the heading and table elements actually appended as children, so two real top-10 tables (Warmest / Coldest) with medals, values and mini bars render; clicking tabs visibly re-ranks; clicking a row loads that year. -
Anomaly calendar shows nothing, and its data/controls are broken.
-
The calendar area is an empty strip:
#cal-gridcontains 12 month blocks but has height 0, so no day cells are visible at 1440 px or 390 px. Only a short stray line "———" shows under the legend. -
The Year dropdown contains only two options: "2026 (preliminary)" and "1893". Selecting any other year is impossible. It must list every year in the daily data, newest first, and default to 2025.
-
The dropdown shows 2026 while the summary chip says "2025: 0 days warmer, 365 days cooler than normal; mean anomaly −45.9 °F". A −45.9 °F mean anomaly is impossible (real yearly anomalies are within a few °F), so the anomaly is being computed against the wrong thing (e.g. a missing/zero or misaligned normal). Expected: anomaly = ((Tmax+Tmin)/2 for that date) − (1991–2020 smoothed normal mean temperature for that calendar day), values mostly within ±15 °F, with a sensible split such as "2025: 205 days warmer, 158 cooler; mean anomaly +1.6 °F".
-
Legend layout: at 1440 px it reads "−15 °F [bar] 0 +15 °F" with "0" at the right end of the bar; at 390 px "+15 °F" wraps onto its own line. Expected one bar with −15 at the left, 0 centred under the middle, +15 at the right. Expected overall: 12 visible mini month calendars (4 across desktop, 3 across tablet, 2 across phone), each day a coloured square in its correct weekday column, hatched squares for missing days, hover/tap tooltip with date, Tmax, Tmin, mean, normal and anomaly; selecting a year, or clicking a leaderboard row, redraws it.
-
-
The GDD normal band is filled solid black. The 10–90 % band polygon renders with fill rgb(0,0,0) at full opacity, so a thick black ribbon covers the median line and most of the compare-year line (desktop and phone). The legend swatch says "Normal band (10–90%)" in light grey. Expected: a light, semi-transparent neutral or warm-grey band (e.g. steel/silver at ~15–20 % opacity) behind the lines, with the median as a clearly visible dashed dark line, the selected year as the bold gold line and the compare year in teal on top.
-
Planting date picker is blank and cannot pick a day. It is now an
<input type="month">showing "--------- ----" with an empty value, so the user can't see or set Apr 20 (the note below says "if you plant Apr 20"). A month input also has no day. Expected: a visible planting-date control that shows the current date and lets the user choose month and day — e.g. a normal date input whose year is always kept equal to the selected Year, or two selects (Month, Day) side by side — changing it redraws the curve, stage table, readout and freeze-odds note. -
Stage thresholds for spring wheat, peas, lentils and potatoes are still implausible; the wheat values are wrongly credited to NDAWN. The stage table makes it obvious: spring wheat "Maturity 750 · reached May 28 (normal May 27)"; peas (650) mature in early June; lentils (550) in May; potatoes (900) in June. In the Palouse, spring wheat heads around late June and matures in late July; peas and lentils flower in mid/late June and mature late July–early August; potatoes planted in early May initiate tubers in mid/late June and mature in September. The Data & sources panel says "Spring wheat (NDAWN wheat table): tillering ≈150, jointing ≈400, heading ≈600, maturity ≈750" — NDAWN publishes no such numbers. NDAWN's rule is: ≈180 °F-GDD (base 32) from planting to emergence, +72.5 to Haun stage 1, then +143 per Haun stage, which gives Haun 3 (tillering) ≈ 540, Haun 6 (jointing) ≈ 970, Haun 10 (heading) ≈ 1,540, Haun 12 ≈ 1,825; physiological maturity is later (≈ 2,000+ ; not published by NDAWN). To sanity-check, here are the 1991–2020 median cumulative GDD at typical Palouse stage dates, computed from the raw station file:
-
Spring wheat, base 32, planted Apr 20: Jun 1 ≈ 900 · Jun 25 ≈ 1,520 · Jul 10 ≈ 2,030 · Jul 25 ≈ 2,520
-
Dry peas, base 40, planted Apr 15: Jun 15 ≈ 840 · Jul 1 ≈ 1,160 · Jul 20 ≈ 1,660 · Aug 1 ≈ 1,960
-
Lentils, base 34, planted Apr 20: Jun 20 ≈ 1,270 · Jul 5 ≈ 1,700 · Jul 25 ≈ 2,330 · Aug 5 ≈ 2,700
-
Potatoes, base 45, planted May 1: Jun 15 ≈ 480 · Jul 1 ≈ 710 · Aug 1 ≈ 1,370 · Sep 10 ≈ 2,140
-
Sweet corn, base 50 cap 86, planted May 15: Aug 15 ≈ 1,140 · Sep 1 ≈ 1,390 · Sep 15 ≈ 1,530 Expected: wheat stages from the NDAWN rule above (tillering, jointing, heading, soft dough, maturity ≈ 2,100–2,300); pea, lentil and potato stages chosen so they land at those typical dates, labelled in the UI as "approximate, calibrated to typical Palouse timing" (not as published figures). Sweet corn: harvest (milk stage) should come before "maturity", not after — use e.g. silk ≈ 1,000–1,150 and harvest ≈ 1,350–1,500 and drop the separate "Maturity 1450 / Harvest 1600" ordering. Canola's last marker should read "Ripe (> 1,874)". With realistic values the stage lines will spread up the chart — keep the label de-overlap (currently "Maturity · 750" and "Heading · 600" still overlap at the right edge on desktop and are unreadable on phone).
-
-
Citation invented. Data & sources says "Rochdi et al. 2025, Sci. Total. Environ." for https://www.sciencedirect.com/science/article/pii/S037837742500469X. That author name and journal were not given anywhere and appear made up (the 0378-3774 ISSN in that URL is the journal Agricultural Water Management). Expected: cite it by its title — "Base and upper temperature thresholds to support the calculation of growing degree days aiming at their use with the FAO56rev crop coefficients curve: A review" (ScienceDirect, 2025) — with no invented authors. Also fix the wheat attribution (item 5). Never present a number as coming from a source unless it is in that source.
-
Frost legend prints "null". After the two legend entries (Spring / Fall) the word
nullappears (desktop and phone) when the ≤ 32 °F threshold is selected. Expected: nothing there for 32 °F, and the "NOAA 1991–2020 ticks" legend entry only for 28 °F. -
Dates shown as "05-19" / "09-22". KPI tiles ("Last spring freeze (50/50) 05-19", "First fall freeze 09-22") and frost chips use MM-DD codes, while the chart labels say "May 20". Expected: human dates everywhere in the UI ("May 19", "Sep 22"); keep MM-DD only in CSV. Also the chip says May 19 but the chart's 50 % label says May 20 — make them agree.
-
GDD readout wording. "2025 reaches 5,852 GDD by Dec 1 (from Apr 20) — +547 vs normal" compares totals on Dec 1, after the season. Expected: compare on a meaningful date — the last stage's normal date, or a user-visible "as of" date (the hovered date, or Sep 30), e.g. "By Aug 1: 2,950 GDD, +4 % vs normal (≈ 3 days ahead)". For 2026, use its last observed date (Sep 7) and say it is preliminary.
-
Re-check everything on phone (390 px) after the fixes: the calendar must show all 12 months without the page scrolling sideways, the leaderboard tables must fit (stack the two tables), the planting control must be usable, and stage labels readable.
-
"Days ahead / behind" has the wrong sign. Potatoes, 2025, planted Apr 20: readout says "By Aug 25: 2,057 GDD — +8 % vs normal (≈ 6 days behind)", but the stage table right below shows 2025 reached maturity Aug 19 vs normal Aug 25 — 6 days ahead. Same for every crop (wheat "+2 % … ≈ 2 days behind" while maturity is Jul 13 vs normal Jul 15). Expected: more GDD than normal / reaching a stage earlier = "ahead"; fewer / later = "behind".
-
Pea, lentil and potato stages still land about a month too early and contradict the app's own text. With the default Apr 20 planting the stage table shows: dry peas Flowering ≈350 → May 23, Pod fill ≈800 → Jun 14, Maturity ≈1,300 → Jul 7; lentils Flowering ≈480 → May 18; potatoes Tuber initiation ≈320 → May 31. Yet Data & sources says "peas flower mid/late June and mature late July–early August; lentils flower in June…; potatoes initiate tubers mid/late June". Using the 1991–2020 median GDD at those dates (computed from the raw station file, see the previous feedback) the values should be roughly:
-
Dry peas (base 40): flowering ≈ 850–1,150, pod fill ≈ 1,300–1,500, maturity ≈ 1,650–1,950
-
Lentils (base 34): flowering ≈ 1,250–1,500, pod fill ≈ 1,700–1,900, maturity ≈ 2,300–2,700
-
Potatoes (base 45, planted early May): tuber initiation ≈ 480–710, bulking ≈ 1,000–1,400, maturity ≈ 2,100–2,300
-
Sweet corn (base 50/cap 86, planted mid-May): silk ≈ 1,000–1,150, harvest (milk stage) ≈ 1,350–1,500 (currently 600 / 1,200) After changing them, check in the rendered stage table that the normal dates really fall in those windows, and keep the "≈ approximate, calibrated to typical Palouse timing" labelling. Also: when a crop preset is chosen, set a typical planting date for it (e.g. spring wheat Apr 20, dry peas Apr 15, lentils Apr 20, canola Apr 25, potatoes May 1, sweet corn May 20) — the user can still change it. Planting sweet corn and potatoes on Apr 20 by default is unrealistic.
-
-
Custom base/cap: legend shows "nullnull" and there is still no normal band. Choose "Custom base / cap", set base 41 and cap 80: the legend reads "2025 nullnull 2020", and the footnote says "No normal band is drawn while a custom cap is in use — the stored normal assumes an 86 °F cap". The band is computed from the embedded daily data per year, so it can be computed for any base and cap. Expected: median line + 10–90 % band for every custom base/cap, normal legend entries shown, no "null" text anywhere.
-
NOAA ticks on the ≤ 28 °F frost chart are cluttered and unreadable. Six full-height dark-teal vertical lines with labels "NOAA 90%", "NOAA 10%", "NOAA 50%", "NOAA f10%", "NOAA f50%", "NOAA f90%" cross the whole chart; "NOAA 50%" sits on top of the "10% · May 15" label on desktop, and at 390 px the labels overlap into an illegible jumble ("NOAA NOAA f90%)Nov 5"). "f10%" is cryptic. Expected: plot NOAA's six official dates as small hollow diamond markers at (date, probability) on the same axes — e.g. spring 10 % at Jun 8 sits at the 10 % level — so the user can see how close the station curve is to NOAA's; no full-height lines; a legend entry "◇ NOAA 1991–2020 official (≤ 28 °F)"; details ("NOAA: 10 % chance of a ≤ 28 °F freeze after Jun 8") in the hover/tap tooltip rather than as permanent labels.
-
Leaderboard ranks years with big data gaps. "Coldest GDD 32–86": #1 is 1982 (3,957.5 GDD), #2 1897, #6 2009, #10 2008. Per data/raw/SOURCES.md, 1982 is missing Tmax on 75 days (58 of them Apr–Oct), 1897 has 66 days with a value missing, 2009 is missing all of June and 2008 all of October — their totals are low because days are missing, not because they were cold. seasons.json reports
missing: 0for 1982, so a day with only Tmax or only Tmin missing is not being counted as missing. Expected: a day counts as missing if either value is missing; a year is left out of a ranking if its window for that metric has more than ~5 missing days; add a one-line note under the tables stating the rule. -
Leaderboard season definitions and labels don't match. "Warm season (Apr–Oct)" is computed over days 91–272 (Apr 1–Sep 29), and "Cold season (Nov–Mar)" averages Jan–Mar with Oct–Dec of the same calendar year. Expected: warm season = Apr 1–Oct 31; winter = Nov 1 of the previous year through Mar 31, displayed as "1933–34". Headings read awkwardly ("Warmest Cold season (Nov–Mar)") — use e.g. "Warmest growing seasons (Apr–Oct)" / "Coolest growing seasons", "Mildest winters (Nov–Mar)" / "Harshest winters". Show GDD as whole numbers (not "7,211.5 GDD"). In the Coldest table the mini bars are inverted (the #1 coldest year has the shortest bar); make the #1 row the longest bar in both tables.
-
Tapping the GDD or frost chart on a phone shows no tooltip. At 390 px with touch, tapping inside the GDD chart shows nothing (tapping a calendar day works). Expected: a tap on either chart shows the tooltip and the vertical guide line for that date; tapping elsewhere hides it.
-
Frost chip ignores the threshold. With "≤ 28 °F" selected the chip still says "Median frost-free season (≤ 32°F): 131 days". Expected: the chip follows the selected threshold (the ≤ 28 °F season is longer).
-
"Normal season GDD" KPI is a calendar-year total. The tile shows "6,148 · Spring wheat · base 32°F, cap 86°F" — that is Jan 1–Dec 31, not a season. Expected: normal GDD from the chosen planting date to Sep 30 (or to the crop's last stage), labelled that way, updating when crop or planting date change.
-
GDD curve CSV has normal values before planting. In
moscow_uof_i_gdd_curve_2025_planted_Apr_20.csvthe first row is2025-01-01,,17,10,26— the year column is blank before planting but normal_median/low/high are 17/10/26. Expected: all curve columns blank (or 0) before the planting date, cumulative from planting afterwards, matching the chart; include crop, base and cap in a header comment or columns. -
2026 calendar: not-yet-reported days look like missing data. Oct–Dec 2026 (and Sep 8 onward) use the same hatched "no observation" cells as genuinely missing days. Expected: future/unreported days drawn as plain empty outlines with tooltip "not yet reported — 2026 data end Sep 7 (preliminary)"; hatching reserved for real gaps.
-
Small polish. In the "How to use" steps, mention that leaderboard rows are clickable and charts/calendar days can be hovered or tapped. The Data & sources list is a dense wall of text — break the methods into short labelled sub-points (Normal band · Freeze odds · Anomalies · Crop stages) so it scans easily.
-
The new "Tip:" line in the intro is laid out as broken columns. It is the first thing visitors see. At 1440 px it renders as four separate columns: "Tip:" | "hover or tap" | "the GDD and frost charts (or any calendar day) for details, and" | "click a leaderboard row" | "to load that year into the planner and calendar." with large gaps between them. At 390 px it becomes five squeezed columns with one or two words per line ("the / GDD / and / frost / charts / (or / any / calendar / day) / for / details,") making the intro card very tall. Expected: one ordinary sentence that wraps like the paragraph above it, with the key phrases in bold, e.g. "Tip: hover or tap the charts or any calendar day for details, and click a leaderboard row to load that year." (probably a flex or grid container is being applied to an inline sentence).
-
Tapping the GDD or frost chart on a phone still shows no tooltip. At 390 px with touch, a tap on either chart fires
pointerdown→pointerup→pointerleave(touch pointers always "leave" when the finger lifts). The tooltip text is filled in on pointerdown but the pointerleave handler immediately sets it back to opacity 0, so nothing is ever visible. (Calendar-day taps do work.) Expected: for touch input (pointerType "touch") keep the tooltip and the vertical guide line visible after the finger lifts, move them on the next tap, and hide them on a tap outside the chart or when the page scrolls. Mouse hover behaviour stays as it is. -
Leaderboard mini bars are inverted or invisible. GDD tab: in "Warmest years" the #1–#3 rows (1934, 1958, 2015) have only a dot while #4–#10 have long bars; in "Coldest years" every row is just a dot. Cold season tab: "Mildest winters" #1 (1934–35, 42.5 °F) has a dot and #10 the longest bar. Expected: in every table the #1 row has the longest bar and the bars shrink down the list — e.g. bar length proportional to how far the value is from the all-years median for that metric, scaled so #1 fills the bar track; never a bare dot for a top-ranked row.
-
Leaderboard headings have doubled parentheses: "Warmest years (annual GDD) (top 10)", "Coldest years (annual GDD) (top 10)". Expected e.g. "Warmest years · annual GDD · top 10".
-
Frost legend shows two diamonds: at ≤ 28 °F the legend reads "◇ ◇ NOAA 1991–2020 official (≤ 28 °F)" (a drawn swatch plus a text "◇"). Expected: one diamond swatch.
-
Custom base/cap readout contradicts itself: base 41 / cap 80 planted May 1 reads "By Sep 30: 3,460 GDD — +15 % vs normal (roughly even with the normal year)". 15 % more GDD is not "roughly even". Expected: compute days ahead/behind the same way as for crops (the date the normal median reaches the selected year's Sep 30 total), or leave the parenthetical out for custom curves.
-
Explain why the NOAA diamonds sit weeks away from the station curve. At ≤ 28 °F NOAA's official dates (spring 90/50/10 % = Apr 27 / May 14 / Jun 8; fall 10/50/90 % = Sep 6 / Sep 23 / Oct 9) are 2–3 weeks later in spring and earlier in fall than the station curve (Mar 28 / Apr 27 / May 15 and Sep 19 / Oct 12 / Nov 5). Part of it is the period: I recomputed from the raw file for 1991–2020 only and got a median last ≤ 28 °F spring freeze of about May 6 and first fall freeze about Sep 28 (full record: Apr 27 / Oct 12); the rest is NCEI's own method (gap filling from neighbouring stations, their probability fitting). A first-time user will otherwise think one of them is wrong. Expected: a one- or two-sentence note under the frost chart (and in Data & sources) saying NOAA's dates cover 1991–2020 and use NCEI's methods, while the curves use every year of the station record. Nice to have: a small "Years: Full record | 1991–2020" toggle for the frost chart, computed from the embedded daily data, so users can compare like with like.
-
The "1991–2020" frost view draws both curves upside down. Select "≤ 28 °F", then "1991–2020":
-
the spring curve starts at 0 % on Mar 1 and rises to 100 % by late May, staying at 100 % until Jul 1;
-
the fall curve is at 100 % from Jul 1 to mid-September and then falls to 0 % by November;
-
the markers read "90% · Mar 1", "10% · Mar 1", "90% · Jul 2", "10% · Jul 2" (nonsense), while the chips correctly say May 4 / Sep 28. Each year is being counted on the wrong side of its freeze date: spring should count a year for a date when that year's last spring freeze falls on or after the date; fall should count it when the first fall freeze falls on or before the date (years with no freeze in the window never count). The curves must have the same shapes as the full-record view (spring falling, fall rising). Reference values I computed from the raw file for 1991–2020 (years with ≤ 20 missing days per half-year):
-
≤ 28 °F: spring 90 % ≈ Apr 2, 50 % ≈ May 4–6, 10 % ≈ May 16 · fall 10 % ≈ Sep 15, 50 % ≈ Sep 28, 90 % ≈ Oct 20
-
≤ 32 °F: spring 90 % ≈ May 7, 50 % ≈ May 22, 10 % ≈ Jun 7 · fall 10 % ≈ Sep 6, 50 % ≈ Sep 17, 90 % ≈ Oct 3 Also the chip "Median frost-free season (≤ 28°F): 172 days" does not change when switching to 1991–2020; it should be recomputed for the period.
-
-
"Days ahead / behind" is inverted again (regression) and gives nonsense values. With 2025 and default plantings: dry peas "+3 % vs normal (≈ 2 days behind)" although the stage table shows maturity Jul 24 vs normal Jul 26 (2 days ahead); potatoes "+16 % vs normal (≈ 53 days behind)" although maturity is Aug 31 vs normal Sep 14 (14 days ahead); sweet corn "+22 % vs normal (roughly even with the normal year)"; custom base 41 / cap 80 "+14 % vs normal (roughly even…)". Expected: for crops, use the last-stage dates already in the stage table — "≈ 14 days ahead" when the selected year reached the last stage 14 days before the normal, "behind" when later (this is what round 5 did, and it was right). For custom curves, compare the date the selected year reached the normal median's Sep 30 total with Sep 30 (earlier = ahead). Say "roughly even" only when the difference is 0–1 day; if it cannot be computed, leave the parenthetical out rather than saying "roughly even".
-
Tapping the GDD or frost chart on a phone still never shows a tooltip. At 390 px with touch, tap inside the GDD chart: the tooltip text is filled in but its opacity is 0 immediately and stays 0. The tap on the GDD chart is also received by the frost chart's "tap outside hides the tooltip" handler (and by the same handlers left over from every earlier re-render of both charts, which keep piling up on the document), and since both charts share one tooltip element, those handlers hide it straight away. Expected: a tap on a chart shows its tooltip and guide line and they stay visible; only a tap that is outside every chart (and not on a calendar day) hides them; re-rendering a chart (changing crop, year, threshold, resizing) must not add more document-level handlers.
-
NOAA explanation is duplicated and self-contradictory. At ≤ 28 °F the same explanation appears twice — once as a paragraph above the chips ("Why the ◇ dates sit weeks from the curve…") and again at the end of the footnote. The footnote also calls 1991–2020 "a warmer period" while saying its median last spring freeze is later (≈ May 5 vs Apr 27), which suggests colder springs, not warmer. Expected: keep one short note (e.g. under the chart), describe 1991–2020 simply as "a different, shorter period", and hide it at ≤ 32 °F where no NOAA dates are shown.
-
In
scripts/build_data.py,warmuses day indexes 91..272 (Apr 2 – Sep 30).colduses Jan–Mar plus Oct–Dec of the SAME calendar year.mwarmandmcoldcount missing days over different windows again. The UI, though, says "Apr–Oct" and "Winters run Nov 1 of the previous year through Mar 31". It labels 1934's value as "1934–35". Result: the ranks shown are wrong. The app currently shows "Mildest winter 1934–35 42.5 °F" and "Harshest 1985–86 28.9 °F", but no Nov–Mar winter has those values. Fix: warm season = Apr 1 – Oct 31 of year y (365-day index 90..303 inclusive), mean of daily (max+min)/2 over days where both are present;mwarm= days in that same window with max or min missing. -
winter = Nov 1 of year y-1 through Mar 31 of year y, stored on year y, displayed as "(y-1)–yy" (e.g. "1933–34").
mcold= days in that same window with max or min missing. The winter ending in 2026 (Nov 2025–Mar 2026) is complete and must be allowed, even though the 2026 row is otherwise partial. Exclude the Apr–Oct 2026 warm season (it is incomplete). -
Keep the "more than 5 missing days → left out" rule, applied to each window.
-
Rename the seasons-CSV columns to match the real windows, e.g.
warm_season_apr1_oct31_fandwinter_nov1_prev_to_mar31_f. -
Expected (±0.1 °F): Warmest Apr–Oct: 1958 60.4, 2015 59.8, 1936 59.7, 1938 59.7, 1987 59.6.
-
Coolest Apr–Oct: 1919 52.9, 1895 54.2, 1916 54.3, 1912 54.6, 1903 54.8.
-
Mildest winters: 1933–34 41.3, 2025–26 39.6, 1991–92 39.1, then 1939–40 and 2014–15 at 38.8.
-
Harshest winters: 1916–17 27.7, 1948–49 27.7, 1978–79 27.8, 1984–85 28.8, 1921–22 29.5.
-
dayGdd()insrc/app.jscomputesmax(0, min(cap, (mx+mn)/2) − base). NDAWN's method adjusts each temperature first. Use this per day:hi = min(max(Tmax, base), cap),lo = min(max(Tmin, base), cap),GDD = (hi + lo)/2 − base. Wheat (NDAWN): base 32 °F; cap 70 °F until 395 GDD have accumulated since planting, 95 °F after that. -
Canola (NDAWN): base 41 °F, no upper cap (floor only).
-
Peas, lentils, potatoes, sweet corn and custom: the preset or custom base and cap (86 °F default).
-
Apply the same clipping (base 32, cap 86) to
gdd32andgdd50inscripts/build_data.py, so the "GDD 32–86" leaderboard and the seasons CSV agree with the planner, then re-run the script. Add one sentence to Data & sources stating the formula. Expected with this formula (normal = 1991–2020 median, ±2 days / ±1 %): Sweet corn planted May 20: normal reaches 1,075 ≈ Aug 6 (currently Aug 14) and 1,425 ≈ Aug 26. -
Canola planted Apr 25 (stage starts from item 3): Rosette 257 ≈ May 14, Early bud 728 ≈ Jun 13, Early flower 933 ≈ Jun 24, Early ripening 1,398 ≈ Jul 15, Ripe 1,875 ≈ Aug 2.
-
Wheat planted Apr 20: 538 ≈ May 17, 1,181 ≈ Jun 13, 1,567 ≈ Jun 27, 1,739 ≈ Jul 2, 1,825 ≈ Jul 5. 2025 by Jul 15 ≈ 2,229 GDD.
-
Leaderboard "GDD 32–86" year totals: warmest 1934 ≈ 7,230, 1958 ≈ 7,102, 2015 ≈ 7,096; coldest 1916 ≈ 5,386, 1898 ≈ 5,454, 1913 ≈ 5,526.
-
The daily arrays are on a 365-day grid (index = CUM[m-1] + d − 1, with Feb 29 removed). But
doyOf()anddaysInYear()add a leap day. So in every leap year the curve starts one day late. Repro: Year 2024, wheat, planted Apr 20. Hovering Apr 20 shows "2024: — GDD", and the 2024 value by Jul 15 is 2,080 instead of ≈ 2,098 (Apr 20 alone is 19 GDD). -
The default compare year 2020 and 8 of the 30 normal years are affected.
-
The GDD-curve CSV for 2024 has a duplicate trailing "2024-12-31,,,," row.
-
The record starts 1893-11-07 and ends 2026-09-07. Fall 1893 counts as eligible with a "first fall freeze" on Nov 9 (an artifact: the freezes before Nov 7 were never observed). Fall 2026 counts as "no freeze", although its data stop on Sep 7. Fix: a half-year is eligible only if the record covers the whole window (exclude fall 1893 and fall 2026). Apply this to the stored curves and to the 1991–2020 toggle's computation. Show spring and fall counts separately. Expected, full record: spring n = 133, fall n = 131. ≤ 32 °F: median first fall freeze Sep 22, 10 % Sep 6, 90 % Oct 18.
-
≤ 28 °F: median Oct 12, 10 % Sep 19, 90 % Nov 3.
-
Spring values and the frost-free medians are unchanged (131 / 172 days).
-
Planting Feb 10: the "plant Feb 10" marker is drawn left of the plot area and its label is clipped ("nt Feb 10"). Clamp the marker to the plot's left edge and label it "← plant Feb 10".
-
Planting Oct 15: the readout says "By Sep 30: — GDD", the stage table says "Tillering … Nov 27 / not reached", and the KPI shows a value for another date. Show one clear message instead, such as "Planted after Sep 30, so there is too little season left to track crop stages". Either hide the stage table or restrict the planting month select to Feb–Aug.
-
dayGdd()insrc/app.jsstill returnsmax(0, min(cap, (mx+mn)/2) − base), andgdd()inscripts/build_data.pyis the same. NDAWN's method adjusts each temperature BEFORE averaging:hi= Tmax raised tobaseif below it, then capped atcap -
lo= Tmin raised tobaseif below it, then capped atcap -
daily GDD =
(hi + lo) / 2 − base -
Crop caps: Canola: NDAWN uses NO upper cap. Give the canola preset no cap (floor at 41 °F only) and show "no cap" wherever the base and cap are displayed.
-
Every other preset keeps its current cap (86 °F). Custom uses its own base and cap.
-
Expected after the change. The normal is the 1991–2020 median, computed from data/embed/daily.json; allow ±1 day: Spring wheat, planted Apr 20. Normal reaches 538 May 17, 1,181 Jun 12, 1,567 Jun 27, 1,739 Jul 2, 1,825 Jul 5. The KPI "Normal season GDD" (Apr 20 → Sep 30) ≈ 4,490; it is 4,564 now.
-
Canola, planted Apr 25, no cap. Normal reaches 257 May 15, 728 Jun 13, 933 Jun 24, 1,398 Jul 15, 1,875 Aug 3. 2025 reaches 1,875 on Jul 28.
-
Sweet corn, planted May 20. Normal reaches 1,075 on Aug 6 (Aug 14 now) and 1,425 on Aug 26 (Sep 9 now). 2025 reaches them Jul 29 and Aug 17.
-
Potatoes, planted May 1. Normal reaches 600 Jun 17, 1,200 Jul 20, 2,200 Sep 8.
-
Leaderboard "GDD 32–86", allow ±10:
-
warmest: 1934 ≈ 7,230, 1958 ≈ 7,102, 2015 ≈ 7,096
-
coldest: 1916 ≈ 5,382, 1898 ≈ 5,454, 1913 ≈ 5,526
-
These are 7,212 and 5,253 now.
-
-
src/body.htmlstill says "Sweet corn silking ≈ 1,075 with harvest ≈ 1,425 GDD (base 50), per the UDel weekly crop update". That page does NOT contain those figures. It gives only GDD = (Tmax + Tmin)/2 − 50 °F and a "1300 GDD corn" example. Fix: Addapprox: trueto both sweet-corn stages inCROPS, so the table shows "≈" and the footnote appears. -
In Data & sources, say the sweet-corn stage values are approximate planning values, not published figures. Keep the UDel link only as the source of the base-50 GDD idea.
-
Update the "≈ marks …" footnote and the
#gdd-foottext so they name peas, lentils, potatoes AND sweet corn as approximate. -
The frost readout chip says "133 years used". Change it to "133 spring / 131 fall years used". With the 1991–2020 toggle it should read "30 spring / 30 fall".
-
The KPI tile "First fall freeze (50/50)" says "133 yrs". It should show the fall count (131).
1 build 18.7 min · 11 files changed, 2417 insertions(+), 3 deletions(-) Show prompt
Read AGENTS.md, SPEC.md and BRAND.md in this directory. Then build the complete app they describe, step by step: first write scripts in scripts/ that turn the raw data in data/raw/ (see data/raw/SOURCES.md — the primary file is data/raw/acis_stndata_USC00106152_maxt_mint_por.json, daily max/min °F with "M" for missing; 2026 is a partial, preliminary year) into compact JSON in data/embed/ and run them; then write src/body.html, src/app.css and src/app.js; run python3 build.py --check and fix any error it reports. Implement every required feature in SPEC.md with a polished, modern, responsive University of Idaho design. Do not stop until python3 build.py --check succeeds and every feature is implemented.
2 feedback 17.3 min · 11 files changed, 1671 insertions(+), 719 deletions(-) Show prompt
Read FEEDBACK.md in this directory — it lists problems a reviewer found when testing index.html in a real browser. Fix every item, keeping everything that already works, then run python3 build.py --check.
Reviewer feedback — round 1 build (tested in headless Chromium at 1440×900 and 390×844)
Good news first: no console errors, no network requests, the brand shell looks right, the GDD chart redraws for every crop / year / compare-year / custom base & cap change, the frost toggle works and CSV download works. The items below are what still stops this from being a gallery-quality app. Most important first.
3 feedback 1.5 min · 1 file changed, 71 insertions(+), 112 deletions(-) Show prompt
Read FEEDBACK.md in this directory — it lists problems a reviewer found when testing index.html in a real browser. Fix every item, keeping everything that already works, then run python3 build.py --check.
Reviewer feedback — round 2 build (tested in headless Chromium at 1440×900 and 390×844)
Real progress: the frost curves are now correct (they match my own recomputation from the raw file: ≤ 32 °F median last spring freeze May 19, first fall freeze Sep 22), the 10/50/90 % markers and chips are right, there is no phone overflow, KPI tiles appear, the GDD normal now starts from the planting date, the stage table is a good addition, and the seasons CSV has meaningful freeze columns. No console errors. The items below are still broken or wrong — most important first. Please test each fix by actually reading the rendered DOM/values, not only node --check.
4 continue 31.3 min · 7 files changed, 410 insertions(+), 267 deletions(-) Show prompt
Read FEEDBACK.md in this directory — it lists problems a reviewer found when testing index.html in a real browser. Fix every item, keeping everything that already works, then run python3 build.py --check.
Reviewer feedback — round 2 build (tested in headless Chromium at 1440×900 and 390×844)
Real progress: the frost curves are now correct (they match my own recomputation from the raw file: ≤ 32 °F median last spring freeze May 19, first fall freeze Sep 22), the 10/50/90 % markers and chips are right, there is no phone overflow, KPI tiles appear, the GDD normal now starts from the planting date, the stage table is a good addition, and the seasons CSV has meaningful freeze columns. No console errors. The items below are still broken or wrong — most important first. Please test each fix by actually reading the rendered DOM/values, not only node --check.
5 feedback 21.9 min · 7 files changed, 519 insertions(+), 338 deletions(-) Show prompt
Read FEEDBACK.md in this directory — it lists problems a reviewer found when testing index.html in a real browser. Fix every item, keeping everything that already works, then run python3 build.py --check.
Reviewer feedback — round 4 build (tested in headless Chromium at 1440×900 and 390×844 with touch)
Big improvement — the leaderboard, the anomaly calendar (every year, correct weekdays, sensible anomalies, tooltips), the light normal band, Month/Day planting selects, NDAWN wheat stages and the human-readable dates all work now, with no console errors and no sideways scrolling on phone. Keep all of that. What remains is accuracy and polish — most important first.
6 feedback 10.5 min · 5 files changed, 333 insertions(+), 131 deletions(-) Show prompt
Read FEEDBACK.md in this directory — it lists problems a reviewer found when testing index.html in a real browser. Fix every item, keeping everything that already works, then run python3 build.py --check.
Reviewer feedback — round 5 build (tested in headless Chromium at 1440×900 and 390×844 with touch)
Excellent round: ahead/behind is correct, crop stages now land on sensible Palouse dates, custom base/cap has a real band, NOAA markers are diamonds, the leaderboard excludes gappy years with proper winter labels ("1953–54"), the frost chip follows the threshold, the curve CSV is blank before planting and 2026's unreported days are distinct. No console errors, no overflow. Keep all of it. A few remaining problems — most important first.
7 feedback 19.0 min · 3 files changed, 96 insertions(+), 83 deletions(-) Show prompt
Read FEEDBACK.md in this directory — it lists problems a reviewer found when testing index.html in a real browser. Fix every item, keeping everything that already works, then run python3 build.py --check.
Reviewer feedback — round 6 build (tested in headless Chromium at 1440×900 and 390×844 with touch)
Good: the intro tip is now a normal sentence on desktop and phone, leaderboard bars shrink monotonically with #1 longest, headings and the frost legend are clean, and the "Full record | 1991–2020" toggle is a great addition. No console errors, no overflow. Four problems remain — please verify each in the rendered page, not only in a DOM stub.
8 continue 19.0 min · 3 files changed, 136 insertions(+), 74 deletions(-) Show prompt
Read FEEDBACK.md in this directory — it lists problems a reviewer found when testing index.html in a real browser. Fix every item, keeping everything that already works, then run python3 build.py --check.
Reviewer feedback — round 6 build (tested in headless Chromium at 1440×900 and 390×844 with touch)
Good: the intro tip is now a normal sentence on desktop and phone, leaderboard bars shrink monotonically with #1 longest, headings and the frost legend are clean, and the "Full record | 1991–2020" toggle is a great addition. No console errors, no overflow. Four problems remain — please verify each in the rendered page, not only in a DOM stub.
9 critic 3.9 min · 1 file changed, 122 insertions(+) Show prompt
Read FEEDBACK.md in this directory — it lists problems a reviewer found when testing index.html in a real browser, with the exact expected values computed from data/raw. Fix every item (items 1-5 first; they are data-accuracy problems), keeping everything that already works. Re-run python3 scripts/build_data.py after changing it, then run python3 build.py --check.
Reviewer feedback (critic pass) — tested in real Chromium at 1440x900 and 390x844
Everything else works well: no console errors, no phone overflow, tooltips, toggles, CSV downloads and row clicks all work. Keep all of that. The items below are ordered by priority. The first five are data honesty problems: numbers or citations that do not match their labels or sources. The reviewer checked every expected value below independently against data/raw/acis_stndata_USC00106152_maxt_mint_por.json and the cited web pages (you have no network access, so the source content you need is quoted here).
1. Leaderboard "Warm season" and "Cold season" are computed over the wrong days (and so is the CSV)
2. Wheat stages are attributed to NDAWN but do not match NDAWN's table
The app shows "Jointing 970", "Heading 1,540", "Soft dough 1,825" and "Maturity 2,150", described as the "NDAWN rule". NDAWN's wheat table (https://ndawn.ndsu.nodak.edu/help-wheat-growing-degree-days.html) gives, in °F GDD since planting: Emergence 180, Leaf 1 252, Leaf 2 395, Leaf 3 (tillers begin) 538, Leaf 4 681, Leaf 5 824, Leaf 6 967, Leaf 7 1,110, Flag leaf visible 1,181, Flag leaf emerged 1,255, Boot swelling begins 1,396, Boot completed 1,539, Heading begins 1,567, Headed 1,682, Flowering begins 1,739, Flowering completed 1,768, Kernel watery ripe 1,825. It gives NO GDD values for milk, dough, soft dough, hard dough or physiological maturity. Fix: use these wheat stages with NDAWN's names: Tillers begin (Leaf 3) 538, Flag leaf visible 1,181, Heading begins 1,567, Flowering begins 1,739, Kernel watery ripe 1,825. Remove Jointing 970, Soft dough and Maturity 2,150, or keep maturity only as a clearly marked "≈" approximate value that is NOT attributed to NDAWN. Update the readout text (for example "needs ≈1,825 GDD for kernel watery ripe") and the Data & sources paragraph.
3. Canola stage thresholds use the END of each NDAWN range as if it were the start
NDAWN canola table (https://ndawn.ndsu.nodak.edu/help-canola-growing-degree-days.html), °F GDD: Seedling 0–256, Rosette 3rd leaf 257–396, Rosette 4th leaf 397–727, Early bud 728–828, Late bud 829–932, Early flower 933–1,165, Late flower 1,166–1,397, Early ripening 1,398–1,634, Late ripening 1,635–1,874, Ripe >1,874. The app shows "Rosette 450", "Bud 932" and "Early flower 1,165". 450 is not in the table. 932 is the END of late bud, and 1,165 is the END of early flower. Fix: use each stage's START: Rosette (3rd leaf) 257, Early bud 728, Early flower 933, Early ripening 1,398, Ripe 1,875.
4. Sweet-corn stage values are attributed to a page that does not contain them
The UDel weekly crop update page (sites.udel.edu/weeklycropupdate/?p=17630) gives only the formula GDD = (Tmax + Tmin)/2 − 50 °F and a "1300 GDD corn" maturity example. It does NOT give silking 1,075 or harvest 1,425. Fix: mark the sweet-corn stages "≈" (approximate planning values, not published figures), in the table, footnote and Data & sources, the same way peas, lentils and potatoes are marked. Remove the claim that the 1,075/1,425 figures come from UDel.
5. GDD formula: clip Tmax/Tmin before averaging, as NDAWN does (currently the cap is applied to the mean)
6. KPI tile "Normal season GDD" shows a stale planting date and value
Repro: load the page, then choose Crop preset "Dry peas" (planting becomes Apr 15). The tile still says "Apr 20 → Sep 30 · Dry peas" and its value was computed from Apr 20. Change the planting month or day and the tile does not update at all. For example, with planting Oct 15 it still shows "3,990 · May 20 → Sep 30". Cause: applyCrop() calls renderKPIs() before applyPlantDefaults(), and the plant-date handlers never call renderKPIs(). Fix: re-render the KPIs after the planting date is set, and whenever the month, day, year, base or cap changes.
7. Leap years are off by one day (and one day of data is lost in build_data.py)
Fix: index the data with the 365-day grid in every year (no leap offset). Export 365 CSV rows. Also, in scripts/build_data.py the leap-day "fold" OVERWRITES Feb 28 with Feb 29's values. Skip Feb 29 instead, so Feb 28 keeps its real observation.
8. The GDD legend prints the word "null" when Compare year is "(off)"
lg.replaceChildren(..., hasCmp ? el(...) : null) inserts the text "null". Filter out null items before calling replaceChildren.
9. Frost curves count two half-years the record does not cover
Update "133 spring- and 133 fall-eligible years" in Data & sources.
10. Data & sources hard-codes 1991–2020 freeze dates that disagree with the app's own toggle
The text says the 1991–2020 median last spring freeze (≤ 28 °F) is "≈ May 5" and the first fall freeze "≈ Sep 29". The frost chart's 1991–2020 toggle shows May 4 and Sep 28, and the reviewer's independent computation agrees with May 4 / Sep 28. Make the text match (or fill it in from the computed values).
11. Planting dates outside Mar 1 – Sep 30 look broken
12. 2026 readout compares two different dates
Sweet corn, Year 2026 shows "By Sep 9: 1,437 GDD — +0 % vs normal (≈ 4 days ahead)". 2026 data end Sep 7, so the 2026 value is from Sep 7 while the normal is from Sep 9. When the selected year's data end before the comparison date, compare both at the last observed day and say so, e.g. "By Sep 7 (latest data)".
After fixing, run python3 scripts/build_data.py and then python3 build.py --check.
10 continue 11.7 min · 10 files changed, 236 insertions(+), 112 deletions(-) Show prompt
Read FEEDBACK.md in this directory — it lists problems a reviewer found when testing index.html in a real browser, with the exact expected values computed from data/raw. Fix every item (items 1-5 first; they are data-accuracy problems), keeping everything that already works. Re-run python3 scripts/build_data.py after changing it, then run python3 build.py --check.
Reviewer feedback (critic pass) — tested in real Chromium at 1440x900 and 390x844
Everything else works well: no console errors, no phone overflow, tooltips, toggles, CSV downloads and row clicks all work. Keep all of that. The items below are ordered by priority. The first five are data honesty problems: numbers or citations that do not match their labels or sources. The reviewer checked every expected value below independently against data/raw/acis_stndata_USC00106152_maxt_mint_por.json and the cited web pages (you have no network access, so the source content you need is quoted here).
1. Leaderboard "Warm season" and "Cold season" are computed over the wrong days (and so is the CSV)
2. Wheat stages are attributed to NDAWN but do not match NDAWN's table
The app shows "Jointing 970", "Heading 1,540", "Soft dough 1,825" and "Maturity 2,150", described as the "NDAWN rule". NDAWN's wheat table (https://ndawn.ndsu.nodak.edu/help-wheat-growing-degree-days.html) gives, in °F GDD since planting: Emergence 180, Leaf 1 252, Leaf 2 395, Leaf 3 (tillers begin) 538, Leaf 4 681, Leaf 5 824, Leaf 6 967, Leaf 7 1,110, Flag leaf visible 1,181, Flag leaf emerged 1,255, Boot swelling begins 1,396, Boot completed 1,539, Heading begins 1,567, Headed 1,682, Flowering begins 1,739, Flowering completed 1,768, Kernel watery ripe 1,825. It gives NO GDD values for milk, dough, soft dough, hard dough or physiological maturity. Fix: use these wheat stages with NDAWN's names: Tillers begin (Leaf 3) 538, Flag leaf visible 1,181, Heading begins 1,567, Flowering begins 1,739, Kernel watery ripe 1,825. Remove Jointing 970, Soft dough and Maturity 2,150, or keep maturity only as a clearly marked "≈" approximate value that is NOT attributed to NDAWN. Update the readout text (for example "needs ≈1,825 GDD for kernel watery ripe") and the Data & sources paragraph.
3. Canola stage thresholds use the END of each NDAWN range as if it were the start
NDAWN canola table (https://ndawn.ndsu.nodak.edu/help-canola-growing-degree-days.html), °F GDD: Seedling 0–256, Rosette 3rd leaf 257–396, Rosette 4th leaf 397–727, Early bud 728–828, Late bud 829–932, Early flower 933–1,165, Late flower 1,166–1,397, Early ripening 1,398–1,634, Late ripening 1,635–1,874, Ripe >1,874. The app shows "Rosette 450", "Bud 932" and "Early flower 1,165". 450 is not in the table. 932 is the END of late bud, and 1,165 is the END of early flower. Fix: use each stage's START: Rosette (3rd leaf) 257, Early bud 728, Early flower 933, Early ripening 1,398, Ripe 1,875.
4. Sweet-corn stage values are attributed to a page that does not contain them
The UDel weekly crop update page (sites.udel.edu/weeklycropupdate/?p=17630) gives only the formula GDD = (Tmax + Tmin)/2 − 50 °F and a "1300 GDD corn" maturity example. It does NOT give silking 1,075 or harvest 1,425. Fix: mark the sweet-corn stages "≈" (approximate planning values, not published figures), in the table, footnote and Data & sources, the same way peas, lentils and potatoes are marked. Remove the claim that the 1,075/1,425 figures come from UDel.
5. GDD formula: clip Tmax/Tmin before averaging, as NDAWN does (currently the cap is applied to the mean)
6. KPI tile "Normal season GDD" shows a stale planting date and value
Repro: load the page, then choose Crop preset "Dry peas" (planting becomes Apr 15). The tile still says "Apr 20 → Sep 30 · Dry peas" and its value was computed from Apr 20. Change the planting month or day and the tile does not update at all. For example, with planting Oct 15 it still shows "3,990 · May 20 → Sep 30". Cause: applyCrop() calls renderKPIs() before applyPlantDefaults(), and the plant-date handlers never call renderKPIs(). Fix: re-render the KPIs after the planting date is set, and whenever the month, day, year, base or cap changes.
7. Leap years are off by one day (and one day of data is lost in build_data.py)
Fix: index the data with the 365-day grid in every year (no leap offset). Export 365 CSV rows. Also, in scripts/build_data.py the leap-day "fold" OVERWRITES Feb 28 with Feb 29's values. Skip Feb 29 instead, so Feb 28 keeps its real observation.
8. The GDD legend prints the word "null" when Compare year is "(off)"
lg.replaceChildren(..., hasCmp ? el(...) : null) inserts the text "null". Filter out null items before calling replaceChildren.
9. Frost curves count two half-years the record does not cover
Update "133 spring- and 133 fall-eligible years" in Data & sources.
10. Data & sources hard-codes 1991–2020 freeze dates that disagree with the app's own toggle
The text says the 1991–2020 median last spring freeze (≤ 28 °F) is "≈ May 5" and the first fall freeze "≈ Sep 29". The frost chart's 1991–2020 toggle shows May 4 and Sep 28, and the reviewer's independent computation agrees with May 4 / Sep 28. Make the text match (or fill it in from the computed values).
11. Planting dates outside Mar 1 – Sep 30 look broken
12. 2026 readout compares two different dates
Sweet corn, Year 2026 shows "By Sep 9: 1,437 GDD — +0 % vs normal (≈ 4 days ahead)". 2026 data end Sep 7, so the 2026 value is from Sep 7 while the normal is from Sep 9. When the selected year's data end before the comparison date, compare both at the last observed day and say so, e.g. "By Sep 7 (latest data)".
After fixing, run python3 scripts/build_data.py and then python3 build.py --check.
11 critic 2.6 min · 7 files changed, 125 insertions(+), 174 deletions(-) Show prompt
Read FEEDBACK.md in this directory — a reviewer re-tested index.html in a real browser; three items remain (two of them were reported as done last round but the code was not changed). Fix all three, keeping everything that already works. Re-run python3 scripts/build_data.py after changing it, then run python3 build.py --check, then re-read dayGdd() in src/app.js and gdd() in scripts/build_data.py to confirm the new formula is really there.
Reviewer feedback (critic pass 2), tested in real Chromium
The last round fixed most items, and the reviewer re-verified them in the browser: leaderboard windows, NDAWN wheat and canola stages, KPI refresh, leap years, legend, frost eligibility, planting edge cases and the 2026 readout. Keep all of that. Three items remain.
1. GDD formula still caps the daily MEAN. Not done last round, although the summary said it was
Apply the same formula to gdd32 (base 32, cap 86) and gdd50 (base 50, cap 86) in scripts/build_data.py, then re-run it. Add one sentence to Data & sources that states the formula.
2. Sweet-corn stage values are still attributed to UDel. Not done last round
3. Frost year counts: the fall curve now uses 131 years, but the UI still says 133
After fixing, run python3 scripts/build_data.py and then python3 build.py --check. Then open src/app.js and confirm that dayGdd() now clips hi and lo before averaging.
What the agent was asked
The full specification the harness received, rendered from the original Markdown.
Known limitations
Reported by the independent critic. ✎ written by the AI critic
- Cosmetic: for the canola preset (no upper cap), the crop note reads 'cap none°F' and the readout and axis read 'cap no cap'.
- Stage GDD values for dry peas, lentils, potatoes and sweet corn are approximate planning values, not published figures. The app marks them with '≈' and says so in Data & sources.
- Wheat uses a flat 86 °F cap, not NDAWN's 70 °F cap before Haun stage 2 and 95 °F after. The independent check found stage dates differ by at most 1 day.
- The ScienceDirect 2025 base-temperature review citation could not be verified (the page returns HTTP 403 to automated fetch).
- Carried over from the build driver and not re-tested in this pass: on a phone, the first tap on a chart right after tapping a calendar day may show no tooltip.
- chartPointer() adds a new window scroll listener on every chart re-render, so listeners pile up over a long session. No visible effect was found.