Virtual Titration Lab
Acid–base titration and buffer simulator
Run acid–base titrations as many times as you want: choose the analyte and titrant, add drops from an animated burette, watch the indicator change, and compare your curve with the exact equilibrium calculation.
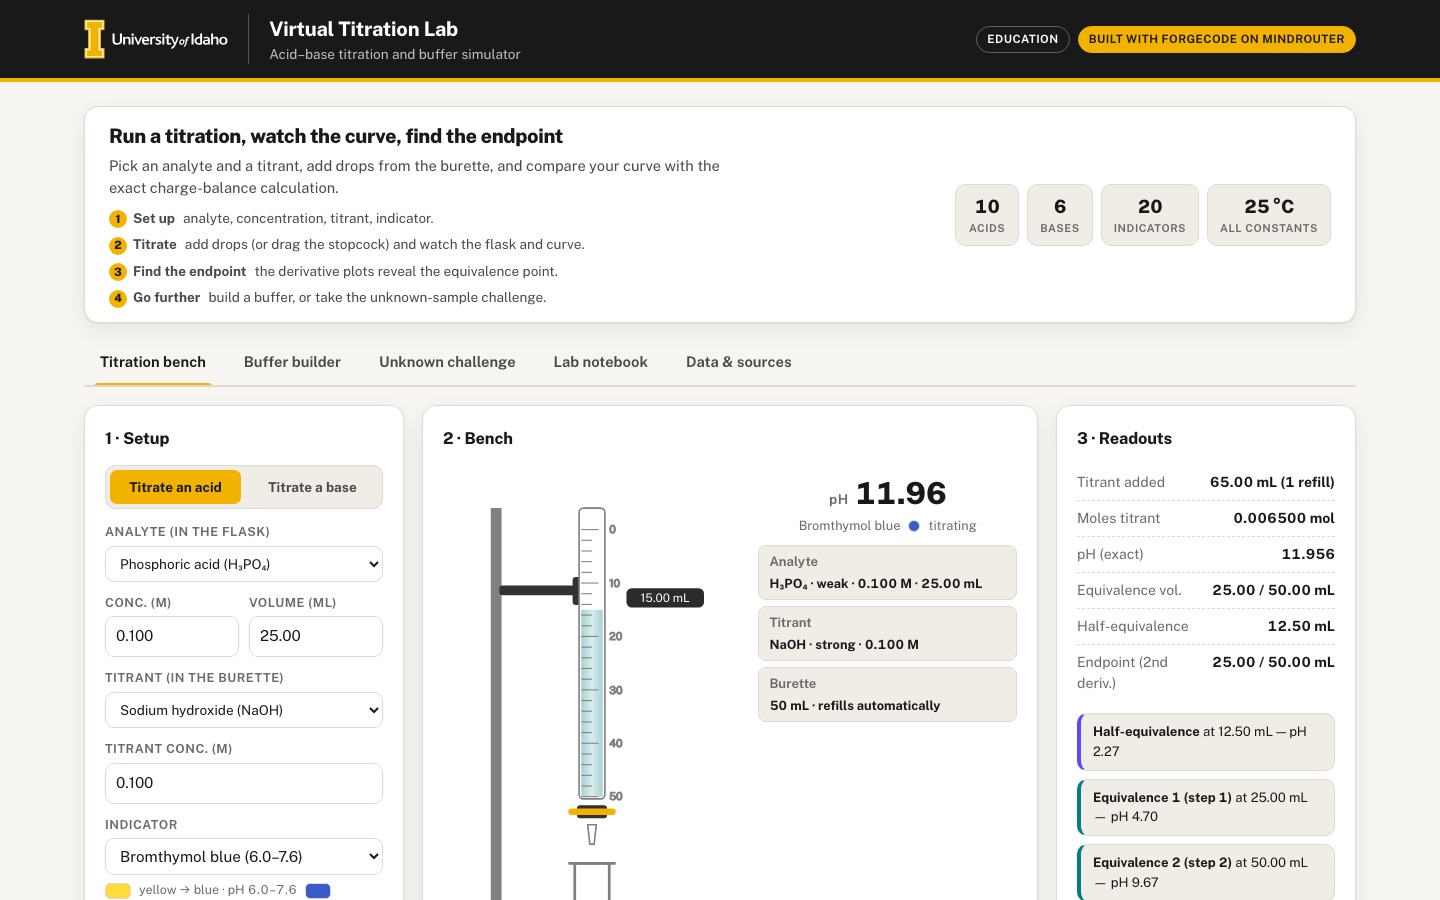 Desktop · click to enlarge
What it is ✎ blurb written by the AI critic
A virtual acid-base titration bench: choose an acid or base, add titrant drop by drop from an animated burette, and watch the indicator color and the titration curve change while an exact charge-balance solver computes the pH. Derivative plots locate each equivalence point, a buffer builder compares the exact pH with Henderson-Hasselbalch and charts buffer capacity, and an unknown-acid challenge scores how well you identify a sample.
Try this
- Choose phosphoric acid, set the indicator to thymol blue and press Auto-titrate: two jumps appear in the curve while the flask goes from orange-red to yellow to blue.
- Switch to 'Titrate a base', titrate ammonia with HCl, and compare methyl red with phenolphthalein to see which one changes color at the equivalence point.
- Open Unknown challenge, draw a sample, titrate a little past the jump, hover the curve at half the equivalence volume to read the pKa, then submit the acid and its concentration.
Highlights ✎ written by the AI critic
- Exact charge-balance pH for 10 acids (including polyprotic phosphoric, carbonic, oxalic and sulfurous) and 6 bases, drawn point by point against the exact curve
- First- and second-derivative plots that find each equivalence point automatically, such as 25.00 and 50.00 mL for phosphoric acid
- Animated burette, stopcock and flask with 20 indicators whose colors follow their pH ranges, including two-step indicators like thymol blue
- Buffer builder with exact pH, Henderson-Hasselbalch comparison, final volume and a buffer-capacity chart
- Unknown-acid challenge with a pKa candidate list and itemized score, plus a lab notebook with CSV export
Who it's for
General chemistry students (CHEM 111/112), lab instructors, high-school outreach
Features
- Animated lab bench: burette with stopcock slider and drop button, flask whose color follows the chosen indicator's transition range
- Exact pH computation (charge-balance solver, including polyprotic acids) and a live titration curve that grows point by point
- Equivalence and half-equivalence detection with first- and second-derivative plots
- Buffer builder: pick a weak acid/conjugate base, set concentrations, see buffer capacity and Henderson–Hasselbalch comparison
- Unknown-sample challenge mode: identify the acid and its concentration from your own titration, with scoring
- Lab-notebook table of readings with CSV export
Data & sources
- openstax.org — OpenStax Chemistry 2e, Appendix H: Ionization Constants of Weak Acids (Ka values only).
- openstax.org — OpenStax Chemistry 2e, Appendix I: Ionization Constants of Weak Bases (Kb values only).
- openstax.org — OpenStax Chemistry 2e, Section 14.1 (Kw = 1.0e-14 only).
- openstax.org — OpenStax Chemistry 2e, Section 14.7: indicator color-change pH ranges and colors read from Figure 14.19 (litmus from Figure 14.20).
- Solver check: reviewer's own exact charge-balance calculation (2026-09-13) for 25.00 mL of 0.100 M HCl titrated with 0.100 M NaOH at 13 volumes. It is not taken from any textbook and is embedded as data/embed/solver_check.json.
How it was built
Written by ForgeCode 2.13.21 (forgecode.dev) on qwen/qwen3.8-27b, served by MindRouter, the University of Idaho's on-premises AI platform.
Rounds by kind
| build | 1 |
| feedback | 9 |
| continue | 1 |
| critic | 6 |
Lines of code per file
| body html | 455 |
| app css | 555 |
| app js | 1,963 |
| scripts | 355 |
Critic scores ✎ scored by the independent AI critic, 1–10
Independent audits ✎ by the AI critic
Automated checks
Checked by critic-verify.
Data spot checks ✎ written by the AI critic
- Constants table vs data/raw/SOURCES.md: acetic Ka 1.8e-5 vs '1.8 x 10^-5'; oxalic Ka2 6.1e-5 vs '6.1x10^-5'; dimethylamine Kb 5.9e-4 vs '5.9x10^-4'; Kw 1.0e-14 vs Section 14.1 '1.0 x 10^-14' - all match
- Indicator table vs SOURCES.md image-derived column: thymol blue '1.2-2.8, 8.0-9.2' vs 1.2-2.8 / 8.0-9.2; methyl orange 3.2-4.5 vs 3.2-4.5 (alt-text error noted); litmus 4.6-8.0 vs Figure 14.20 derived 4.6-8.0 - match
- Solver-check table (reviewer's own HCl/NaOH values, no textbook data) vs my independent exact quadratic: 6.25 mL 1.222 vs 1.2218; 24.95 mL 4.000 vs 3.9996; 26.50 mL 11.464 vs 11.4643 - match; app Max |solver - reference| = 0.000 over 13 volumes
- Computed: 20.00 mL 0.150 M oxalic acid + 0.100 M NaOH: UI pH 1.679 / 2.876 / 8.395 at 15 / 30 / 60 mL vs independent charge-balance solver 1.6793 / 2.8760 / 8.3947 - match
- Computed: 50.00 mL 0.050 M dimethylamine + 0.200 M HCl: UI pH 10.749 at 6.25 mL and 6.081 at 12.50 mL (equivalence) vs independent 10.7489 / 6.0812 - match
Round-by-round timeline
Every harness round, in order. The prompts and FEEDBACK.md were written by the AI reviewer; the app code was written by the harness. Expand a round to see the exact prompt and the FEEDBACK.md the harness received.
-
The pH solver is wrong for every weak and polyprotic acid. Setup was 25.00 mL of 0.100 M acetic acid, 0.100 M NaOH, phenolphthalein. The pH readout shows 5.74 at 0 mL, 7.08 after one 0.10 mL drop, and 8.40–8.70 for the whole buffer region. The exact dashed curve is a flat line near pH 8.5 that jumps at 25 mL. The flask is already pink after a few drops. HCl, and every point after the equivalence point, are correct. The values should match Table 14.2 and an exact charge balance, as listed below.
-
Acetic acid: 0 mL → 2.87; 5 → 4.14; 10 → 4.57; 12.5 → 4.74 (= pKa); 20 → 5.35; 24.9 → 7.14; 25 → 8.72; 25.1 → 10.30; 30 → 11.96.
-
Phosphoric acid, 0.100 M, 25 mL: the app returns 7.00 for every volume up to 25 mL. It should give 0 mL → 1.62; 12.5 → 2.27; 25 → 4.70; 37.5 → 7.21; 50 → 9.68; 60 → 11.77.
-
Carbonic acid, 0.100 M: 0 mL → 3.68; 12.5 → 6.37; 25 → 8.35; 37.5 → 10.32; 50 → 11.41.
-
Ammonia, 0.100 M, 25 mL, titrated with 0.100 M HCl: 0 mL → 11.13; 12.5 → 9.26; 25 → 5.28.
The ionization fractions of each acid species must be normalized so they sum to 1. Please add a small self-check that compares the solver with the Table 14.2 rows. Show it in the Data & sources panel, e.g. a "solver vs. textbook" column with the difference.
-
-
The Buffer builder is completely empty. The "Weak acid / conjugate base pair" dropdown has no options. Every result field shows "–", and the capacity chart is blank, whatever I type. Likely cause: the embedded constants mark acids with
kind: "weak"/"strong", but the buffer, challenge and sources code filter on astrengthfield that does not exist in the data. Expected: all weak acids are listed (the ammonium/ammonia pair would be a nice addition). With 0.10 M acetic acid + 0.10 M acetate, the exact pH is 4.745 and H–H gives 4.74. Changing concentrations or adding NaOH should move the numbers, the gauge needle and the red dot on the capacity curve. -
The Unknown-sample challenge is broken. The "Which acid is it?" dropdown only has "— choose —". Pressing New challenge shows "Sample drawn" but the pH reads 0.79. Add drop and Add 10 drops do nothing: NaOH added stays 0.00 mL, the curve stays empty and the flask does not change. Submitting does nothing. The console shows
Uncaught TypeError: Cannot read properties of undefined (reading '1'). Expected: a random acid and concentration from the weak-acid list; drops change pH, flask color and the mini curve. Scoring should be graded, not all-or-nothing: partial credit that shrinks with % concentration error, credit for the right acid, and a small bonus for not overshooting or for fewer drops. Show a running best score and an attempts history. Also give the challenge its own first-derivative mini plot, or an indicator choice, so it can actually be solved. -
Only acids can be put in the flask and only bases in the burette. The spec lists ammonia, HCl and NaOH. Let the user titrate a base analyte (ammonia, NaOH, the amines) with an acid titrant (HCl, or a weak acid). For example, choosing "Ammonia" as analyte should offer HCl as titrant, and the curve should fall from pH 11.1.
-
Polyprotic equivalence points are not handled. Phosphoric acid (0.100 M, 25 mL) reports a single "Equivalence vol. 75.00 mL". The burette only holds 50 mL and the curve axis stops at 55 mL. Expected: list each observable equivalence point and half-equivalence point (phosphoric: 25 mL and 50 mL; carbonic: 25 and 50 mL). Draw a marker line for each on the curve. Explain that the third proton of phosphoric acid is too weak to show a jump. Allow refilling the burette or a larger range.
-
Endpoint detection never reports anything. After auto-titrating acetic acid past equivalence, "Endpoint (2nd deriv.)" stays "–" and no endpoint card appears. The first-derivative plot marks its "peak" at 0.5 mL instead of near 25 mL. Expected: once the user has passed the jump, show the volume of the first-derivative maximum and the second-derivative zero crossing. Mark both on the main curve and in the derivative plots. Compare them with the stoichiometric equivalence volume ("your endpoint 25.05 mL vs. true 25.00 mL, error 0.2 %"). The half-equivalence card should show pH ≈ pKa, e.g. 4.74 for acetic acid.
-
Auto-titrate is slow and never stops. After 9 s it had only reached 18.75 mL, and it keeps going until stopped by hand. Expected: it runs a full curve to about 2× the (last) equivalence volume in roughly 8–15 s, with smaller steps near each equivalence point, then stops by itself with a status message. The stopcock slider should work like a real stopcock: it sets the flow rate (closed → dropwise → open), and titrant flows while it is open, with drops animating faster. It should not jump the total volume to a slider percentage.
-
The bench does not look like a real setup yet. The burette sits at the far left and the flask sits in the middle of the card, so the animated drop falls into empty space instead of into the flask mouth. Mount the burette on a stand directly above the flask. Make the liquid level in the flask rise as titrant is added, and add a gentle swirl or ripple when a drop lands. Let the flask color fade smoothly between readings. The burette volume label is clipped ("18.75 m"). Add readable graduation numbers (0, 10, 20 … 50 mL) on the burette. The bench card also has large empty areas; use the space.
-
The lab notebook becomes an unreadable dump. One auto-titration added 200+ rows. Rows from different runs are mixed with no separation (0.10…0.50 mL, then 0.25, 0.50 …). Expected: a "Run" column, and a group header or filter per run with the setup (analyte, concentrations, indicator). Log single drops and manual readings, but only a sampled set of points from auto-titration (e.g. every 0.5 mL plus the points around equivalence), and flag manual readings. Allow deleting a run. The CSV should include run, analyte, titrant, concentrations, volume, pH and indicator color. The CSV download itself works; keep it.
-
Phone (390 px): the titration curve is unreadable. The main chart is scaled down to about 330×130 px. Its axis labels are about 5 px tall and the lines are hairlines. Expected: charts re-layout at narrow widths with taller aspect, fewer ticks and legible labels of at least 11 px. The tab bar also wraps into three uneven rows. Make it a single horizontally scrollable row (or a compact segmented control) with the active tab visible.
-
Derivative plot axes are wrong. The first-derivative y-axis shows the labels "1, 1, 1, 0, 0, 0" because small tick values are rounded to integers. The two derivative cards take only two of three grid columns on desktop, leaving an empty third column. Use sensible decimals, label both axes (mL; dpH/dV), and give the derivative charts a hover crosshair or tooltip.
-
Add hover and touch tooltips to the main titration curve showing volume and pH at the pointer, for both your points and the exact curve. Highlight the buffer region and the indicator's transition band (shaded horizontal band in the indicator's colors) on the chart. Changing the indicator should visibly move that band.
-
Stray files:
.debug.jsand.validate.jswere left in the project root. Delete them (keep any checks you want insidescripts/). -
Good progress: The burette now stands over the flask.
-
The buffer and challenge dropdowns are filled.
-
Challenge scoring and history work.
-
The phone tab bar scrolls in one row.
-
Page crash on load: the Titration bench is dead. On opening index.html the console shows
Uncaught ReferenceError: r is not defined at renderSources(called frominit). It is in the new "solver vs. textbook" check table. A variableris used outside the callback where it is defined, near the end of renderSources. Because init stops there, the bench never initializes:-
The pH readout shows "–".
-
The Titration curve, First derivative and Second derivative cards are empty white boxes.
-
The "Analyte" and "Titrant" facts show "–".
-
Add drop does nothing: 0.00 mL, no points.
-
The lab notebook stays empty.
Expected: no console errors, and a working bench at load with the exact curve drawn.
-
-
The pH solver is still wrong. I called the app's own
titrationPHin the browser: 25.00 mL analyte at 0.100 M, 0.100 M titrant. -
What goes wrong, as observed: (a) A pure weak acid solution comes out too acidic, so the ionization fractions still do not sum to 1. For an n-protic acid, the denominator is [H⁺]ⁿ + K₁[H⁺]ⁿ⁻¹ + K₁K₂[H⁺]ⁿ⁻² + … + K₁…Kₙ. The fraction of the species that has lost i protons is its own term divided by that same sum.
-
(b) HCl in the flask gives pH 7, so a strong-acid analyte is ignored. It looks like it is treated as a "weak acid with no Ka steps".
-
(c) As soon as any titrant is added, the result is pH 0.00. The conjugate base created by neutralization is given the acid's Ka list, but the base term reads a Kb that does not exist.
-
A simpler model avoids all of this and needs no neutralization bookkeeping: Keep the total concentration of each acid family. A family is the analyte acid, or the protonated form BH⁺ of a weak base, with Ka = Kw/Kb, diluted to the current total volume.
-
Keep the total [Na⁺] from NaOH, the total [Cl⁻] from HCl, and for a weak base the total [BH⁺]+[B], with the "extra" positive charge of the acid form.
-
Solve [H⁺] + [Na⁺] + Σ(positive species) = [OH⁻] + [Cl⁻] + Σ(anion charges) by bisection over pH −1…15.
-
scripts/check_solver.pyexists. Make the JS solver pass these table values within ±0.02, away from the exact equivalence volume. Also make the Data & sources "solver vs. textbook" table show them with small differences. Challenge mode math. It follows from item 2: after 350 drops the challenge pH is 0.00 at every point, the curve is a flat line at 0, and the flask never turns pink. So the challenge cannot be solved from the titration. The scoring UI itself (score chip, best score, history) is good; keep it. -
Challenge mini-charts are poorly scaled. In the derivative mini-plot the axis labels are about 20 px, much larger than the rest of the UI. The "peak 0.2 mL" label overlaps the y-axis labels. The challenge flask is still the old plain flask without a burette. Expected: the same 11–12 px tick labels as the main charts, and the same stand/burette/flask artwork as the bench, at a smaller size.
-
The burette artwork has overlapping labels. On the bench, the "0.00 mL" reading text overlaps the burette tube and the "25" graduation number. The graduation numbers "0 / 25 / 50" and the "mL" label sit on top of the glass and the clamp. Expected: graduation numbers outside the tube on one side, and the live reading in a small pill beside the meniscus that does not collide with the numbers. Show the meniscus moving down as titrant is used.
-
Buffer builder edge cases and labels.
-
The pair dropdown text is cut off: "Acetic acid / Acetic acid conjugat…". Use short names such as "Acetic acid / acetate (CH₃CO₂H / CH₃CO₂⁻)".
-
With 0.001 M acid + 0.001 M base + 5 mL of 1.00 M NaOH, the base is in large excess, yet the app still prints an H–H value (13.046) as if it were meaningful. Show "H–H not applicable — strong base in excess" instead.
-
Add a simple "add strong acid (HCl)" control next to the NaOH one.
-
Show the pH change a small addition causes: "adding 1.0 mL of 0.10 M NaOH changes the pH by +0.04; in pure water the change would be +3.0". Buffer capacity is then tangible.
-
At low concentrations the capacity chart is dominated by the water terms at pH 0 and 14, so the buffer peak at pKa is invisible. Mark the buffer's own contribution separately (e.g. shaded area), or clip the y-axis to the buffer region.
-
-
Empty CSV export gives no feedback. With no notebook rows, clicking Export CSV does nothing. Expected: disable the button with a tooltip, or show a short message "No readings yet — run a titration first".
-
Derivative cards layout. On desktop, the First and Second derivative cards still use only 2 of 3 grid columns, leaving an empty gap on the right. Make them share the full width equally, or put them side by side under the curve at full width.
-
Bench right column. The fact list (Analyte, Titrant, Burette "50 mL · refills automatically") and the pH readout float in the middle of a mostly empty column. Once the bench works, check that the pH readout is large and near the flask. Also check that the facts show the actual analyte and titrant.
-
Keep everything that works now: the phone tab row
-
the stand/burette/flask layout
-
buffer and challenge dropdowns
-
challenge scoring and history
-
the sources tables
-
the no-external-requests rule
-
Progress: The load crash is gone and there are no console errors.
-
Auto-titrate now stops by itself (12 s, 50 mL).
-
The indicator band on the curve is nice.
-
Challenge scoring works.
-
But every pH the app shows is still wrong. Your own "Solver self-check" table in Data & sources proves it: the HCl solver column is 7.00 in all 19 rows;
-
the CH₃CO₂H column runs 1.93 → 2.11, where the book gives 2.87 → 12.52;
-
"Max |solver − Table 14.2| = 10.408".
-
The solver has four specific defects. All four must be fixed.
-
(a) HCl and NaOH are treated as if they were not there.
currentConfig()andchConfig()overwrite each species'kindfield with "acid"/"base". ButstrengthOf()decides strong vs. weak by checkingkind === "strong". So the strong/weak information is lost, and HCl and NaOH become "weak" species with an empty constant list that contribute no charge. Symptoms:-
an HCl flask reads pH 7.00;
-
adding NaOH never changes any pH;
-
acetic acid reads about 2 all the way to 50 mL;
-
the challenge flask never turns pink.
Keep acid/base side and strong/weak as two separate fields.
-
-
(b) The ionization-fraction denominator is wrong. For an acid with n ionizable protons, the denominator must be [H⁺]ⁿ + K₁[H⁺]ⁿ⁻¹ + K₁K₂[H⁺]ⁿ⁻² + … + K₁K₂…Kₙ. The first term is the undissociated acid, [H⁺]ⁿ. The code starts the sum at [H⁺]ⁿ⁺¹ and never adds the undissociated term, so the fractions do not sum to 1. Symptom: 0.100 M acetic acid alone gives pH 1.93 instead of 2.87. 0.155 M gives 1.86 instead of 2.78.
-
(c) The weak-base charge is inverted. For a weak base B, such as ammonia, the positive charge in solution is carried by the protonated form BH⁺. The charge contribution is C × (fraction still protonated). The code instead adds C × (fraction deprotonated), so a stronger push toward B makes the solution more positive. Expected: 0.100 M NH₃ gives pH 11.13. 25 mL of 0.100 M NH₃ + 12.5 mL of 0.100 M HCl gives 9.26, and + 25 mL gives 5.28.
-
(d) The Buffer builder models the conjugate base wrongly. The conjugate base is its sodium salt, e.g. sodium acetate. So the acid family's total concentration is C_acid + C_base, and [Na⁺] = C_base + any NaOH added. The app currently models the base as a separate "weak base" family. Symptoms, all for acetic acid in 100 mL:
-
-
After the fix these must hold (25.00 mL of 0.100 M analyte, 0.100 M titrant): acetic + NaOH: 0 mL → 2.87; 5 → 4.14; 12.5 → 4.74; 20 → 5.35; 24.9 → 7.14; 25 → 8.72; 25.1 → 10.30; 30 → 11.96.
-
HCl + NaOH: 0 → 1.00; 5 → 1.18; 24.9 → 3.70; 25 → 7.00; 25.1 → 10.30; 50 → 12.52.
-
phosphoric + NaOH: 0 → 1.62; 12.5 → 2.27; 25 → 4.70; 37.5 → 7.21; 50 → 9.68; 60 → 11.77.
-
carbonic + NaOH: 0 → 3.68; 12.5 → 6.37; 25 → 8.35; 50 → 11.41.
-
A base can never be put in the flask. The analyte list only ever contains acids and the titrant list only bases. The code that swaps the analyte list to bases only runs when an acid titrant is chosen, and no acid titrant is ever offered. Changing the titrant also rebuilds the analyte list and resets my analyte choice to HCl. Steps: choose Acetic acid, then re-select NaOH → the analyte jumps back to "Hydrochloric acid". Expected:
-
an obvious way to titrate a base: e.g. a two-button "Titrate an acid / Titrate a base" switch above the analyte, or grouped option lists;
-
ammonia, NaOH or an amine in the flask with HCl in the burette;
-
the user's current selection kept whenever it is still valid.
-
-
The Lab notebook stays empty. I added 5 single drops, then ran a full auto-titration and a manual Log reading. The Lab notebook tab still says "No readings yet", and Export CSV does nothing. Expected: readings grouped by run, as asked last time, and a CSV download once rows exist. Also show a short message if Export CSV is pressed while the notebook is empty.
-
The stopcock closes as soon as the slider is released. Dragging the stopcock slider adds a few drops, but letting go closes the stopcock. A real stopcock stays where you set it. Expected:
-
titrant keeps flowing at the chosen rate until the slider is moved back to "closed" or the burette is empty;
-
a visible flow state (e.g. "flowing · 0.4 mL/s");
-
a quick "Close" action.
-
-
The burette artwork is still hard to read.
-
The live reading "50.00 mL" is drawn on top of the "25" graduation number.
-
The bottom graduation is labelled "0" where it should read "50".
-
The "mL" and "0" labels at the top sit on the glass.
-
After 50.00 mL has been delivered, the liquid column still looks full.
Expected:
-
numbers 0 / 10 / 20 / 30 / 40 / 50 increasing downward, beside the tube, with no overlap;
-
the liquid level dropping as titrant is used (then refilling with a short animation);
-
the reading in a small tag next to the meniscus.
-
-
Phone (390 px): the titration curve is still unreadable. The main chart renders at about 330×150 px. Its tick labels and the "Phenolphthalein 8.0–10.0" band label are about 4 px tall. Expected: at narrow widths, a taller chart (about 300 px) with tick labels at least 11 px and fewer ticks.
-
Layout: empty third column under the curve. The First and Second derivative cards still use only two of three grid columns on desktop, leaving an empty gap on the right. They should split the full width equally.
-
Buffer builder labels and teaching extras (from the last review, still missing).
-
Names read "Acetic acid / Acetic acid conjugate base (CH₃CO₂H)". Use real names such as "Acetic acid / acetate (CH₃CO₂H / CH₃CO₂⁻)".
-
When strong base exceeds the acid, show "H–H not applicable — strong base in excess" instead of a number.
-
Add an "add strong acid (HCl)" control.
-
Show how much a small addition changes pH, compared with pure water.
-
-
Challenge mini-charts. Once item 1 is fixed, check that the challenge curve rises through a visible jump. Check that its derivative mini-plot uses the same 11–12 px tick labels as the main charts (last round they were about 20 px and the "peak" label overlapped the axis).
-
Keep everything that works: the stand/burette/flask layout
-
auto-stop
-
the indicator band on the curve
-
challenge scoring and history
-
the sources tables and self-check table
-
the single-row phone tabs
-
no external requests
-
Big improvement, and all of this works now. Keep it: Solver: Table 14.2 matches within 0.005. Phosphoric, carbonic and ammonia curves are correct.
-
Buffer builder: exact pH and Henderson–Hasselbalch agree; the HCl control, the "vs. pure water" row and the capacity peak all work.
-
Challenge: the challenge curve rises properly.
-
Bench: the acid/base mode switch, the stopcock with flow state and Close button, and the burette tag all work. Acetic acid shows an endpoint of 25.00 mL with 0.0 % error.
-
Notebook: runs appear and the CSV downloads.
-
The analyte and titrant dropdowns can end up on the same side, e.g. NaOH titrated with NaOH. Steps:
-
(a) Load the page; it is in acid mode with Acetic acid + NaOH.
-
(b) Open the Titrant dropdown and choose Sodium hydroxide, the first option, even though it is already selected.
-
(c) The Analyte list is replaced by the bases and now reads "Sodium hydroxide". The titrant is also NaOH, so the setup is NaOH in the flask and NaOH in the burette.
The same happens in base mode: choose "Titrate a base", then pick any titrant, and both dropdowns become Hydrochloric acid. When the titrant changes, the analyte list is rebuilt with the titrant's side instead of the opposite side. The rebuild also discards the user's analyte choice. Expected:
-
The mode switch alone decides which side each dropdown lists: acid mode → acids in the flask and bases in the burette; base mode → the reverse.
-
Changing one dropdown never rebuilds the other.
-
Both dropdowns keep the user's choice.
-
Every setup change in the notebook currently creates an empty "Run" (see item 6), so this bug produced nine empty "NaOH + NaOH" runs in my session.
-
-
Console errors. On page load the console shows
Error: <rect> attribute height: A negative value is not valid. ("-11.54"). The same error appears again when phosphoric acid is titrated ("-0.198"). It appears to come from the shaded bands on the titration curve (indicator band / buffer region) when a band extends beyond the plotted pH range. Clamp every band to the plot area. The console must be clean. -
Endpoint detection fails when the pH falls. Setup: Titrate a base, Ammonia 0.100 M × 25.00 mL, HCl 0.100 M, Auto-titrate.
-
The endpoint card says "Endpoint (2nd deriv.) at 12.48 mL · 1st-deriv peak 49.50 mL — vs. true 25.00 mL, error 50.1 %". The status line also says "Endpoint: 12.48 mL". Expected: about 25.0 mL. For a falling curve, use the largest |dpH/dV| and the matching second-derivative sign change.
-
The half-equivalence card shows "pKa = NaN". Expected: "pH 9.25 = pKa of NH₄⁺ (pKb of NH₃ = 4.74)".
-
The First-derivative plot draws the negative dip below its x-axis, outside the plot. Its y-axis only covers 0…25. The Second-derivative spike runs off the top and bottom of its card. Expected: the y-axis covers the data, negative values included, and a single tall spike is clipped neatly to the plot area.
-
-
Challenge derivative marks the wrong peak. In the Unknown challenge (e.g. hydrocyanic acid, 0.116 M), the dpH/dV mini-plot labels "peak 0.2 mL". That is the steep start of the curve. The real equivalence bump is near 29 mL. Expected: ignore the first ~1 mL (or the first few points) when locating the peak, so the marker lands on the equivalence jump. Do the same on the main bench.
-
Polyprotic auto-titration overshoots and lists an unobservable point. Phosphoric acid auto-titrates to 150 mL (3× the first equivalence) and the Readouts show "Equivalence vol. 25.00 / 50.00 / 75.00 mL" with a card for step 3. Expected:
-
Stop at about 1.3× the last observable equivalence point (about 65 mL for phosphoric).
-
List only the observable points (25 and 50 mL). Keep the note about the third proton.
-
Detect and report an endpoint for each jump (near 25 and near 50 mL), not only the first.
-
-
The notebook fills with empty runs. Every change to the analyte, titrant, concentration or mode creates a new "Run N" header, even with no readings. All run headers are stacked at the top of the table, and the rows of the latest run sit below them. Expected:
-
Create a run only when its first reading is recorded.
-
Show each run's readings directly under its own header.
-
Make runs collapsible, showing a row count, e.g. "Run 3 — CH₃CO₂H 0.100 M × 25.00 mL + NaOH 0.100 M · 156 readings ▾".
-
-
Phone (390 px): the titration curve is still too small to read. The chart SVG is 316×191 px, but its viewBox is 760×460. The "13 px" tick labels therefore render about 6 px tall, and the indicator-band label is unreadable. Expected: at phone widths, draw the chart in a coordinate system close to its real pixel size, so text renders at 11–13 px on screen. Use about 5 x-ticks and 7 y-ticks. The derivative charts and the challenge charts need the same fix.
-
Empty space under the curve (desktop). The two derivative cards are each 412 px wide inside a 1272 px row, leaving about 440 px empty on the right. Expected: the two cards split the full row width 50/50, or the grid has exactly two columns.
-
The legend overlaps the chart label. On the titration curve (desktop), the "buffer region (pKa … ± 1)" label at the top right is partly hidden behind the legend ("your titration / exact equilibrium / equivalence"). Move the band label inside the band on the left, or give the legend its own row.
-
Buffer pair names are wrong.
-
The dropdown reads "Acetic acid / Acetic (conjugate base) (CH₃CO₂H / CH₃CO₂⁻)" and is cut off in the select box.
-
Several formula pairs are wrong: "Nitrous … (HNO₂ / HNO₂)", "Hydrofluoric … (HF / HF)", "Hydrocyanic … (HCN / HCN)".
Expected names:
-
Acetic acid / acetate (CH₃CO₂H / CH₃CO₂⁻)
-
Formic acid / formate (HCO₂H / HCO₂⁻)
-
Carbonic acid / hydrogen carbonate (H₂CO₃ / HCO₃⁻)
-
Phosphoric acid / dihydrogen phosphate (H₃PO₄ / H₂PO₄⁻)
-
Nitrous acid / nitrite (HNO₂ / NO₂⁻)
-
Hydrofluoric acid / fluoride (HF / F⁻)
-
Oxalic acid / hydrogen oxalate (H₂C₂O₄ / HC₂O₄⁻)
-
Sulfurous acid / hydrogen sulfite (H₂SO₃ / HSO₃⁻)
-
Hydrocyanic acid / cyanide (HCN / CN⁻)
-
Ammonium / ammonia (NH₄⁺ / NH₃)
-
-
Very good progress. All of the following works now; keep it: Solver: exact for every case I tried.
-
Setup: the acid/base dropdowns stay on opposite sides and keep the user's choice.
-
Auto-titrate: phosphoric stops at 65 mL and lists only the observable equivalence points.
-
Charts: phone charts are readable (12 px text) and the derivative cards split the row 50/50.
-
Buffer builder: names and formulas are correct, and the HCl control and "vs. pure water" row work.
-
Notebook: runs are grouped with reading counts; CSV export works.
-
Endpoint detection reports false endpoints at the buffer-region inflection. The second derivative is also zero at the inflection in the middle of the buffer region (near the half-equivalence point), where the curve is flattest, not steepest. The app counts those crossings as endpoints.
-
Acetic acid 0.100 M + NaOH, Auto-titrate: Readouts say "Endpoint (2nd deriv.) 12.48 / 25.00 mL". The card says "Endpoint (2nd deriv.) at 12.48 mL … vs. true 25.00 mL, error 50.1 %".
-
Ammonia + HCl: identical, 12.48 mL and error 50.1 %.
-
Phosphoric + NaOH: "Endpoints: 4.49 / 25.00 / 37.50 / 50.00 mL", "error 82.0 %".
-
Orange dashed endpoint lines are drawn on the curve at 4.49, 12.48 and 37.5 mL, where nothing happens.
-
In the Unknown challenge, the dpH/dV mini-plot labels "peak 1.1 mL" (steep start of the curve) instead of the jump near equivalence.
Expected:
-
An endpoint is where |dpH/dV| has a clear local maximum, a real jump that is many times steeper than the typical slope elsewhere, e.g. more than 5× the median |dpH/dV|. The second-derivative zero crossing inside that jump refines its position.
-
Ignore the first ~1 mL.
-
Each detected endpoint is compared with the nearest stoichiometric equivalence volume:
-
acetic → one endpoint ≈ 25.0 mL, error < 1 %;
-
phosphoric → endpoints ≈ 25 and ≈ 50 mL;
-
ammonia → ≈ 25 mL.
-
-
Draw orange endpoint lines only at real endpoints.
-
-
The derivative plots' x-axis does not line up with the data. In the First- and Second-derivative charts, the plotted spike appears at about 22.3 mL on the tick labels for acetic acid and ammonia, while the curve's jump is at 25.0 mL. For phosphoric the spikes sit at about 22 and 44 mL instead of 25 and 50. This happens on desktop and phone. The tick labels and the plotted points use two different horizontal scales, for example ticks spread over 0…30 but data mapped over a different maximum. Expected: one shared scale for ticks, grid and data, so the spikes sit exactly under the curve's jumps. Ideally, use the same x-range as the main titration curve so the three charts align vertically.
-
A console error remains on page load. The console shows
Error: <rect> attribute height: A negative value is not valid. ("-20.55"). I traced it to the#burette-liquidrect in the stand SVG, set during the burette level/refill animation step. It happens again after auto-titrations that pass 50 mL. Clamp the liquid height to ≥ 0 at every animation step. The console must be completely clean. -
The burette reading is impossible after a refill. After titrating phosphoric acid to 65 mL, the tag on the 50 mL burette reads "65.00 mL". Expected:
-
the tag shows the actual burette scale reading (0–50 mL) at the meniscus;
-
the readouts show "Total delivered 65.00 mL (1 refill)";
-
a short refill animation plays when the burette empties.
-
-
Phone: crowded derivative axes for short runs. After only 3 mL, the Second-derivative chart on a 390 px screen shows 15 overlapping x tick labels ("0.0 0.2 0.4 0.6 … 2.8"). The First-derivative chart's y-axis also runs "0.1 … −0.6" with a clipped curve. Limit charts to about 5 x-ticks at phone width. Before the curve has a jump, a short hint such as "Keep titrating — the derivative peaks at the endpoint" is friendlier than a near-empty plot.
-
Challenge flask artwork. The Unknown-challenge flask is still a plain flask with no burette or drop animation. Reuse the bench's stand + burette + flask artwork at a smaller size, with the drop animation when "Add drop" / "Add 10 drops" is pressed.
-
The buffer pair dropdown is truncated on desktop. The select shows "Acetic acid / acetate (CH₃CO₂H / (" and cuts off the formulas. Let the select span the card width, or show the formulas on a separate line under the select.
-
Excellent progress. The following now works; keep it exactly as it is: Endpoints: acetic, phosphoric (25 / 50 mL) and ammonia all show 0.0 % error. The derivative charts line up with the curve.
-
Console: clean on load.
-
Burette: the tag shows the scale reading, and the total shows "(1 refill)".
-
Challenge: the stand artwork and "peak 38.2 mL" label work.
-
Buffer builder: the formula line under the select works.
-
Phone: tick counts are fine.
-
Strong-acid or strong-base analytes crash once the half-equivalence point is passed. This is the textbook default case, so it matters most.
-
HCl in the flask. Titrate an acid → Hydrochloric acid 0.100 M × 25.00 mL, NaOH 0.100 M, Auto-titrate.
-
The auto-titration freezes at about 12.5 mL and never finishes.
-
The console fills with
Uncaught TypeError: Cannot read properties of undefined (reading 'ka'), hundreds of times. -
No half-equivalence, equivalence or endpoint cards appear.
-
The same error appears when adding 1 mL drops by hand past 12.5 mL.
-
-
NaOH in the flask. Titrate a base → Sodium hydroxide 0.100 M × 25.00 mL, HCl 0.100 M, Auto-titrate: the same failure with
(reading 'kb'), 76 errors in 12 s. -
Cause: the half-equivalence / endpoint card code reads the analyte's first Ka (or Kb) step. A strong acid or base has no steps.
Expected:
-
For HCl and NaOH analytes, no errors, and the auto-titration finishes like the weak-acid case with an endpoint of about 25.00 mL.
-
The half-equivalence card says something like "Strong acid — no buffer region; pH at half-equivalence 1.48 (not a pKa)". For NaOH use the base equivalent, pH 12.52.
-
Check every place that reads the first Ka or Kb step, including the curve's buffer-region band and the notebook/CSV, so strong species are handled everywhere.
-
-
Challenge charts: the tick labels do not match the plotted data. This is the same bug that was fixed on the bench derivative charts. Setup: Unknown challenge → New challenge, then Add 10 drops 45 times, so NaOH added = 45.00 mL.
-
On the challenge titration curve, the last plotted point sits at 40.9 mL on its own x tick labels (ticks 0…45), not at 45.0 mL.
-
On the challenge dpH/dV plot, the last point sits at 38.1 mL on its ticks (0…40), and the spike is drawn left of its "peak" label.
-
Example: formic acid 0.172 M, true equivalence 43.0 mL. The jump appears several mL too early.
This misleads students, who read the equivalence volume off these axes to answer the challenge. Expected: ticks, grid and data share one x scale in both challenge charts, so a point added at 45.00 mL sits exactly on the "45" tick. The peak marker must sit exactly on the spike.
-
-
Phone: the derivative hint overlaps the axis. At 390 px, the "Keep titrating — the derivative peaks at the endpoint" hint in both derivative charts is drawn on top of the y-axis title and the first tick labels ("dpH/dV", "0.00"). Expected: the hint is centered inside the plot area, or placed as a caption under the chart, without overlapping any axis text.
-
Round 8 fixed the strong acid/base crash completely: HCl and NaOH analytes finish with the endpoint at 25.00 mL (0.0 %), and the "no buffer region" cards are clear.
-
The console has zero errors in every test.
-
The phone derivative hint no longer overlaps.
-
X tick labels are placed on a different scale than the data whenever the axis maximum is not itself a tick value.
-
Bench, reproduction. Titrate an acid → Acetic acid 0.137 M × 25.00 mL, NaOH 0.100 M, Auto-titrate. The true equivalence is 34.25 mL, and the readouts correctly say 34.25 mL. But on the Titration curve the jump and the red "eqv 1 34.2 mL" line sit at about 31.2 on the x-axis labels. On the First derivative the spike sits at about 31.2. On the Second derivative the marker labelled "zero 34.2 mL" sits at about 31.2. Every label under the curve is shifted by about 9 %.
-
Challenge, reproduction. New challenge → Add 10 drops ×45, so NaOH added = 45.00 mL. The last point of the challenge curve sits at 40.9 on its ticks. The dpH/dV spike labelled "peak 16.5 mL" sits at about 13.3 on its ticks. That challenge was nitrous acid 0.066 M, true equivalence 16.5 mL.
-
Cause, as observed. The shared axis-drawing function places each tick label proportionally between the first and last tick values, e.g. 0 … 50 across the plot width. The data, equivalence lines and markers are mapped from 0 to the axis maximum, e.g. vMax = 54.8 mL on the bench (1.6 × the equivalence volume) or 49.5 mL in the challenge (1.1 × volume added). When vMax is a round tick value, as with 0.100 M × 25.00 mL, the two agree by coincidence. Otherwise everything is misaligned. The same mismatch can happen on the y-axis of the derivative charts, where the maximum is the largest |dpH/dV|.
Expected:
-
Ticks, grid lines, data, equivalence/half-equivalence lines, endpoint lines, bands and markers all use one scale in every chart: bench curve, both derivatives, both challenge charts, buffer capacity.
-
The simplest fix: after choosing the ticks, extend the axis maximum to the last tick, i.e. round vMax up to the next tick, and use that same maximum for the data. Or position tick labels with the data scale.
-
Verify with a non-round case:
-
Acetic acid 0.137 M → the jump, the red line and both derivative spikes sit exactly at 34.25 mL on the labels.
-
Challenge after 45.00 mL → the last point sits exactly on the "45" tick.
-
-
-
Tick labels still do not line up with the data (x and y axes).
-
Bench, reproduction. Titrate an acid → Acetic acid 0.137 M × 25.00 mL, NaOH 0.100 M, Auto-titrate. The true equivalence is 34.25 mL.
-
On the Titration curve the jump and the red "eqv 1 34.2 mL" line are still drawn at 31.2 on the x labels.
-
The First-derivative spike labelled "peak 34.2 mL" sits at 31.1 on its labels.
-
The Second-derivative marker labelled "zero 34.2 mL" sits at 31.2 on the x labels. It also sits at about −20 on the y labels instead of at 0, and the dashed zero line is drawn at −20 as well.
-
-
Challenge, reproduction. New challenge → Add 10 drops ×45 (45.00 mL added). The last point of the challenge curve sits at 40.5 on its labels (0…45). The dpH/dV curve's last point sits at 35.9 on its labels (0…40).
-
Why it still happens.
axisRange(min, max, count)computes an extended upper boundhi(e.g. 55 when the ticks end at 50). The data are now scaled to lo…hi, but the extra tick is not added to theticksarray, so the returned ticks still end at 50.drawAxes()places its labels and grid lines proportionally between the first and last entries of the ticks array (0…50), across the full plot width. So the labels run 0…50 across the width while the data run 0…55. The same happens on the y-axis whenever the maximum is not a tick.Expected, either of these:
-
axisRangeappends the extended upper bound, and likewise any extended lower bound, to the ticks it returns, so the ticks array always starts atloand ends athi; or -
drawAxesreceiveslo/hiand positions every tick label and grid line with the same mapping as the data.Then verify in the browser, not only by simulating the math:
-
Acetic acid 0.137 M: the jump, red line, peak and zero markers sit exactly at 34.25 mL on every x-axis. The second-derivative zero line sits exactly on the "0" label.
-
Challenge after 45.00 mL: the last point sits exactly on the "45" tick in both challenge charts.
-
The 0.100 M × 25.00 mL default case still shows everything at 25.0.
-
-
The liquid is drawn 30 SVG units (about 6 mL) above the scale. The graduations are drawn in
init()aty = 60 + i*24.8, so 0 mL is at y=60 and 50 mL is at y=308. ButupdateBenchVisuals()andupdateChallenge()position the liquid withy = 30 + (248 - h). Measured at 25.00 mL delivered: the tag says "25.00 mL", but the liquid top is at y=154 while the "25" tick is at y=184. The meniscus reads about 19 mL. At 0 mL the liquid sticks out above the top of the tube (tube top y=40, liquid top y=30). Fix: liquid bottom at y=308, meniscus aty = 60 + (reading/50)*248. The reading tag uses the same y. -
The burette tip and stopcock are hidden inside the flask neck. The tube spans y 40–310 and the stopcock is at y=322, but the flask mouth is at y=250 and the neck runs to y=320. The yellow stopcock handle is invisible and the "50" label is covered by the flask. Fix: move the flask down (or raise and shorten the burette) so the stopcock, its handle and the tip sit clearly ABOVE the flask mouth with a visible gap. The drop should visibly fall from the tip into the mouth, and the handle should rotate as the stopcock slider moves.
-
The stand pole is directly behind the burette and shows through the flask. Put the pole to one side (e.g. x≈40) with a clamp arm reaching across to the burette, like a real ring stand.
-
Graduations are hard to read. Label every 10 mL (0, 10, 20, 30, 40, 50) with minor ticks every 1 or 2 mL, and keep the reading tag from covering the labels.
-
Set 100 mL of 0.10 M acetic / 0.10 M acetate, then add 20 mL of 1.00 M HCl. The app shows: "pH (Henderson–Hasselbalch): n/a — strong base in excess". It is strong ACID in excess.
-
"ΔpH · 1 mL of 1 M NaOH = +2.46". The correct value is +0.05 (pH 1.000 → 1.05).
-
SOURCES.md(Figure 14.19 table) lists second transitions: cresol red, yellow → red at 7.0–8.8 -
thymol blue, yellow → blue at 8.0–9.2
-
alizarin, red → purple/blue at 11.0–12.4
-
Fix: add the second transition (range and colors) in
scripts/make_data.py, then regeneratedata/embed/indicators.json. Use it everywhere the indicator appears:indicatorColor()(three-color interpolation) -
the curve's shaded indicator band (draw both bands)
-
the dropdown label, e.g. "Thymol blue (1.2–2.8, 8.0–9.2)"
-
the notebook "Color" column
-
the sources indicator table
-
The half-equivalence pH, which identifies the acid, cannot be read. The mini curve has no hover or touch readout and a 0–14 axis. Formic (half-eq pH 3.75), nitrous (3.35) and HF (3.21) look the same. Fix: give
#ch-curvethe same crosshair tooltip as the main chart (V and pH of the nearest recorded point). Also add a small "readings" list, or log challenge drops to the Lab notebook as a "Challenge" run. -
Students have no pKa list to match against. Add a compact candidate list with pKa values to the "Your answer" card: acetic 4.74, formic 3.74, nitrous 3.34, hydrofluoric 3.19, hydrocyanic 9.31. Compute these from the embedded Ka values; don't hard-code them.
-
Reaching equivalence takes about 30 clicks of "Add 10 drops" (320 drops for a 0.114 M sample). Add "Add 1 mL" and "Add 5 mL" buttons. The drop count stays volume / 0.10 mL.
-
The score is not explained. Show a breakdown after submitting: identity x/40, concentration x/40 with the % error, endpoint x/10, efficiency x/10. Explain the rules under the answer card BEFORE the user starts. Going a few mL past equivalence to see the whole jump should not lose the endpoint points (allow up to 125 % of V_eq).
-
A blank answer scores 10/100. Submitting with no acid and no concentration gave 10/100 from the efficiency bonus. Require both fields (inline message if missing), and give the efficiency bonus only if the user actually reached the equivalence point. Before a sample is drawn, the answer card should look disabled and show a hint.
-
Analyte concentration −1 → "Equivalence vol. −250.00 mL" and pH 10.60.
-
Concentration 0 → silently uses 0.100 M (the Analyte fact pill says 0.100 M) while the field still shows 0.
-
Fix: Limit the y-axis to about 2.5× the buffer peak (clip the curve to the plot area), or plot pH 2–12 only.
-
Shade the pKa ± 1 band and label the axes ("pH", "β").
-
Add a hover readout.
-
Give the card enough height that it doesn't leave a large empty area under the chart.
-
The bench barely shows above the fold. At 1440×900 the intro card takes the top ~430 px. Make the intro compact: a one-line lede, the 4 how-to steps as a single row of small numbered items, and smaller stat tiles.
-
The bench card has a large empty area with the pH readout floating far right. Put the big pH readout and the fact pills directly beside the flask, vertically centred on it. Put the stopcock controls (Add drop, Auto-titrate, Close) on one row.
-
Selects are truncated ("Sodium hydroxide (NaOH) — st…"). Shorten the option labels (e.g. "NaOH — strong base") or widen the Setup column.
-
Messages from other tabs stay on the bench status line (e.g. "Exported 933 reading(s) to titration-notebook.csv."). Show notebook messages inside the notebook panel instead.
-
Chart labels collide with the data. "Phenolphthalein 8.0–10.0" and "buffer region (pKa … ± 1)" are drawn underneath the curve points, and "zero 25.0 mL" in the 2nd-derivative chart sits on the spike. Draw labels last, on a small rounded white background, offset from lines and points.
-
Round 11 fixed nearly everything I reported. Re-tested and confirmed: Every pH value still matches an independent solver.
-
The burette liquid now lines up with its scale.
-
Buffer ΔpH is correct.
-
Two-range indicators work.
-
The listener leak is gone.
-
Inputs are clamped.
-
The challenge is solvable and scored with a breakdown.
-
The flask geometry was never moved: the flask outline path and
flask-clipstart at the mouth, y=250, and the neck runs to y=320 -
the burette tube spans y 40–310
-
the stopcock is at
translate(130,322) -
the tip path spans y 334–352
-
the drop starts at cy=356
-
Fix (both SVGs): Increase the viewBox height from 470 to about 590.
-
Wrap every flask element in
<g transform="translate(0,120)">: the outline path, the mouth line, the clipPath group withflask-liquidandflask-surface, and the white highlight path. The mouth then sits at y≈370, clearly below the tip at y=352. Keep the JS coordinates for the liquid (350/442) unchanged, because they are inside the translated group. -
Move the stand base rect down to y≈572 and extend the pole to reach it.
-
Make the drop animation fall from the tip (cy 356) to the liquid surface inside the translated flask (≈ y 470 in outer coordinates), then ripple.
-
Check the result: the stopcock, its handle and the 40–50 mL labels must be fully visible above the flask mouth, with a visible gap between the tip and the mouth.
-
The stopcock handle should visibly rotate (e.g. 0° closed → 90° fully open) while the slider is open, and return to 0° on Close.
-
At 1440×900 the middle "2 · Bench" card has a big blank region at the top right. The pH readout and fact pills sit low in the right half, and "Close" wraps onto its own line under "Add drop / Auto-titrate" because
.burette-controlsis limited to 300 px under the stand. In.bench-stage, vertically centre the right column (.flask-wrap { align-self: center; }). Put the big pH readout at the top of that column, with the fact pills under it. -
Move
.burette-controls(stopcock slider, flow state, the three buttons, tip) to a full-width row under both columns (grid-column: 1 / -1, no 300 px max-width), so Add drop, Auto-titrate and Close sit on ONE row on desktop. -
The "3 · Readouts" column (260 px) wraps values: "65.00 mL (1 refill)", "25.00 / 50.00 mL" and the labels "Equivalence vol." and "Endpoint (2nd deriv.)" all break awkwardly. Widen it to 300 px (shrink the middle column), and give
.kv__row ddwhite-space: nowrap. -
Round 12 looks good: The burette, stopcock and tip are now above the flask.
-
The stand is to the side.
-
The controls sit on one row.
-
Every pH value still matches an independent solver.
-
The project owner made a decision, now recorded in the "Data" section of
SPEC.md: The app may use only physical constants from OpenStax Chemistry 2e:-
Ka, Kb and Kw values
-
indicator color-change pH ranges, with each indicator's acid and base colors
-
-
Everything else derived from the book must be removed. Above all, remove Table 14.2, the worked-example titration data, and any panel that reproduces it or compares against it.
-
Keep every other feature exactly as it works today: bench, curves, derivative plots, buffer builder, challenge, notebook and CSV export, the constants table and the indicator table. Do not change the pH solver. It is correct.
-
Read only
SOURCES.mdindata/raw/. Never re-create book tables from memory. -
The reviewer confirmed that these places use Table 14.2 today:
data/embed/reference.json: all of Table 14.2 (19 rows, HCl and CH₃CO₂H) plus its citation. -
scripts/make_data.py: section 3 hard-codesTABLE_14_2and writesreference.json. -
scripts/check_solver.py: two blocks take their expected values from Table 14.2 (the "Acetic acid … (Table 14.2)" and "HCl … (Table 14.2)" blocks). So does the "0.100 M acetic → 2.87" check. -
src/body.html, Data & sources panel:-
the "Reference titration (Table 14.2)" heading and paragraph,
#ref-tableand#solver-check -
the intro sentence "…and reference titration data come from OpenStax"
-
-
src/app.js,renderSources():-
DATA.reference.sourcein the sources list -
the
#ref-tablerows -
the "Max |solver − Table 14.2|" self-check
-
-
Delete
data/embed/reference.json. -
Remove section 3 (
TABLE_14_2and thereferenceobject) fromscripts/make_data.py, so that running it no longer creates that file. Update the docstring. -
src/body.html: remove the "Reference titration (Table 14.2)" heading, its paragraph,#ref-tableand#solver-check. -
src/app.js: remove every use ofDATA.reference/data-reference. That is the sources-list item, the table rows and the self-check. -
Remove CSS rules that only those elements used.
-
After
python3 build.py --check,index.htmlmust contain none of these: "Table 14.2", adata-referencescript tag,ph_acetic, or the book's pH columns. -
Case: 25.00 mL of 0.100 M HCl titrated with 0.100 M NaOH at 25 °C.
-
Data file: put the reference values below in a new
data/embed/solver_check.json.-
Generate it from
scripts/make_data.py, with the numbers hard-coded there. -
Fields:
title,setup(analytehcl, 0.100 M, 25.00 mL; titrantnaoh, 0.100 M),method,source, androwsof{ "ml": …, "ph": … }.
-
-
Label, shown in the UI and stored in the JSON
sourcefield: "Reference pH values: the reviewer's own calculation (2026-09-13), using the exact charge balance [H⁺] + [Na⁺] = [Cl⁻] + [OH⁻] with Kw = 1.0 × 10⁻¹⁴. Not taken from any textbook." -
Table columns: NaOH added (mL) | Reference pH | App solver pH | Δ.
-
Compute "App solver pH" live in the browser with the existing
titrationPH(). -
Show 3 decimals.
-
Print Δ as
0.000whenever |Δ| < 0.0005. Never print "-0.000".
-
-
Summary line under the table: "Max |solver − reference| = X.XXX pH over 13 volumes", with the existing green chip when X < 0.005.
-
Layout: the table sits inside the existing
.table-wrap, so it scrolls sideways on a phone instead of widening the page. -
Delete the "Acetic acid … (Table 14.2)" block and the "0.100 M acetic → 2.87" check.
-
Replace the "HCl … (Table 14.2)" block with the 13 reference values from item 2:
-
tolerance 0.001
-
label them "reviewer's own calculation"
-
read the values from
data/embed/solver_check.json
-
-
Keep the phosphoric, carbonic, ammonia, buffer, "0.155 M acetic" and "0.100 M NH3" checks. Those expected values are not from OpenStax.
-
Update the docstring, which currently mentions Table 14.2.
-
python3 scripts/check_solver.pymust end withFAILURES: 0. -
Make both URLs real
<a>links, withtarget="_blank" rel="noopener". -
Put the same credit text, including the license URL, in
constants.json→creditviamake_data.py. -
Keep the per-source list entries for Appendix H, Appendix I, Section 14.1 and the indicator ranges. Rename the indicator entry to "Indicator color-change pH ranges: read from Figure 14.19 (litmus from Figure 14.20), Section 14.7".
-
In "What is computed, not measured", add one sentence: the solver-check reference values are the reviewer's own calculation.
-
No OpenStax logo, cover image or branding anywhere. There is none today; keep it that way.
-
Notebook and CSV record the wrong indicator color for two-transition indicators. In
logReading()(src/app.js),indColorlooks only atph_low/ph_high. Use the existingindicatorColorName(ind, ph)instead. Repro: 25.00 mL 0.100 M HCl, 0.100 M NaOH, Thymol blue, drop size 1.00, add 30 drops. The flask is blue at pH 12.0, but the notebook row and the CSVindicator_colorboth say yellow. Expected: blue. Cresol red and alizarin have the same problem. -
Buffer capacity β formula is wrong. Both the "Buffer capacity β" readout (
renderBuffer) and the chart (drawBufferCapacity) use2.303·CaCb/(Ca+Cb) + [H+] + [OH-]. The factor 2.303 must multiply every term. Use the exact Van Slyke expression at the solved pH:β = 2.303 · ( [H+] + Kw/[H+] + C_T·Ka·[H+] / (Ka + [H+])² ), where C_T is the total acid-family concentration. Check: at pH 1.00 the water term alone is 2.303 × 0.100 = 0.230. Check values are in item 3, which also includes the added volume. -
Buffer builder ignores the volume of added NaOH/HCl. The total volume stays at the "Total volume" field. Use V_final = buffer volume + mL NaOH + mL HCl for the exact pH, β and the "+1 mL of 1 M NaOH" test (that test uses V_final + 1 mL). Relabel the field "Buffer volume before additions (mL)" and show "Final volume: … mL" in the Result card. Expected values with correct volume and β:
-
Acetic/acetate 0.10/0.10 M, 100 mL, + 20 mL 1.00 M HCl → pH 1.079 (the app now shows 1.000)
-
Acetic/acetate 0.10/0.10 M, 100 mL, + 5 mL 1.00 M NaOH → pH 5.222, β 8.23e-2
-
Hydrofluoric/fluoride 0.20/0.05 M, 250 mL, + 5 mL 1.00 M NaOH → pH 2.798, H–H 2.784, β 1.19e-1, ΔpH for +1 mL of 1 M NaOH +0.03
-
Acetic/acetate 0.10/0.10 M, 100 mL, no additions → pH 4.745, β 1.15e-1 (unchanged)
-
-
Wrong conjugate-acid formulas for weak bases. The half-equivalence card builds
formula + "H⁺"and prints "pKa of NH₃H⁺" and "pKa of (CH₃)₂NHH⁺". Use proper formulas from a small table: NH₄⁺, CH₃NH₃⁺, (CH₃)₂NH₂⁺, (CH₃)₃NH⁺, C₆H₅NH₃⁺. Print the numeric pKa = 14.00 − pKb, e.g. "pH 10.75 ≈ pKa of (CH₃)₂NH₂⁺ (10.77)". Expected pKa values: NH₄⁺ 9.26, CH₃NH₃⁺ 10.64, (CH₃)₂NH₂⁺ 10.77, (CH₃)₃NH⁺ 9.80, C₆H₅NH₃⁺ 4.63. Use "≈", not "=", for weak acids too: the half-equivalence pH only approximates pKa. -
The bench status line re-flashes on every drop after the endpoint. In
detectEndpoints()the conditionbench.v - bench.endpointVol > 0.01is always true once past the endpoint, so each drop callsflashStatus("Endpoint detected …")again. The live "Titrant added: … mL — pH …" line never shows while you keep titrating, and the aria-live region repeats itself. Flash only when the endpoint is first found, or when its detected volume moves by more than 0.05 mL. -
The clamp message is never visible on the bench. Typing 10 into analyte Concentration silently becomes 5.
clampNumshows the message, but the change handler then runsresetBench()→currentConfig()→clampNum()on the already-clamped value, and that call hides the message at once. Keep the message until the user edits that field again. -
"pH" is displayed as "PH". CSS
text-transform: uppercaseturns pH into PH in several places:-
the big bench readout ("PH 2.88") and the challenge readout
-
the notebook column header
-
the Data & sources table headers ("REFERENCE PH", "APP SOLVER PH", "PH RANGE")
-
the field labels Chemistry notation must always read pH. Remove the uppercase transform from those elements, or wrap "pH" in a span with
text-transform: none.
-
-
The setup form is misaligned at 1440 px. The "Concentration (M)" label wraps to two lines, so its input sits 19 px lower than the Volume input beside it. Keep both labels on one line, or align the inputs to the bottom of the row.
-
Bench card details:
-
(a) The burette's major-tick labels (0, 10 … 50) are drawn over the tube's right edge; move them clear of the glass.
-
(b) The Analyte fact tile overflows with long formulas: "(CH₃)₂NH · 0.050 M · 50.00 mL" pokes past the tile border. Let the value wrap or shrink it.
-
(c) The bench card has a large empty area above the pH readout on desktop. Place the readout and fact tiles higher (vertically centered against the stand) so the card looks balanced.
-
-
Buffer capacity chart text is too small on desktop. Tick labels render at about 8 px (a 600-unit viewBox in a 458 px card). Size the viewBox to the rendered width or raise the font sizes so tick labels and the "pKa" label are at least 11 px on screen.
-
Phone (390 px):
-
(a) The intro "how to use" list wraps badly: the bold labels break ("Set / up", "Go / further") and the descriptions form a ragged second column. Stack each label above its description, or keep the label on one line.
-
(b) The derivative charts draw the "Keep titrating — the derivative peaks at the endpoint" placeholder on top of the curve once data exist. Show it only when there is no curve yet, or place it where it cannot overlap the data.
-
(c) On the main curve, the "buffer region (pKa … ± 1)" label sits on the equivalence line and the current-point marker. Move it clear of both.
-
-
The analyte and titrant dropdowns show only formulas ("H₂C₂O₄ — weak acid"), so first-time students cannot tell which acid is which. Use "Oxalic acid (H₂C₂O₄)" style labels, and make sure they are not truncated at 1440 px or 390 px.
-
Round 15 fixed the chemistry and most of the layout. I checked it in a browser: notebook/CSV colors are right
-
β and final volume match my independent values
-
NH₄⁺ and (CH₃)₂NH₂⁺ are shown, with their pKa
-
the status line is right and the clamp message stays visible
-
no "PH" remains, and the inputs are aligned
-
Dropdown text is truncated at 1440 px (regression). The selected option now reads "Acetic acid (CH₃CO₂H) — weak aci", "Sodium hydroxide (NaOH) — stron" and "Hydrochloric acid (HCl) — strong a". Drop the " — weak acid / strong base" suffix from the option text and keep "Acetic acid (CH₃CO₂H)". Show strong/weak next to the Analyte/Titrant facts or in the constants table instead. The longest option, "Aniline (phenylamine) (C₆H₅NH₂)", must be fully visible in the select at 1440 px and at 390 px. Use a smaller font in the select if needed.
-
Buffer recipe card overflows (regression). The "Acid concentration (M)" / "Conjugate-base concentration (M)" row no longer fits: the label shows "CONJUGATE-BASE C…" and the right input extends past the card's right border at 1440 px. Give each field
min-width: 0so the inputs shrink within the card, and let labels wrap, or stack the two fields vertically. -
Burette labels still sit on the glass. With
text-anchor: endat x=146, the labels "0 … 50" are drawn over the tube, whose right edge is x=142. They look struck through at both 1440 px and 390 px. Put them fully outside the tube:text-anchor: startat x ≥ 146. Move the live reading tag (#burette-tag, now at x=148) further right, e.g. x=162, so it does not collide with the labels. Check the challenge burette (#ch-burette-ticks) too. -
Bench card balance on desktop. (a) The bench card still has a large empty area between the "2 · Bench" heading and the pH readout: the readout starts about 250 px below the heading, level with the lower half of the burette. Align the readout column to the top of the stand (
align-self: startwith a small top margin) so the pH value sits beside the top of the burette. (b) The Analyte fact tile now wraps "mL" onto its own line ("25.00 / mL"). Put the label on one line and the value on a second line (stacked) in all three fact tiles, so no value ever splits. -
Phone intro "how to use" list (390 px). Each step now shows the number badge alone on a line, then the label, then a description that starts with a stray "—". Show the badge and the bold label on the same line, with the description below without the leading dash. Keep the desktop layout (one line per step) unchanged.
-
Phone main curve (390 px). The "buffer region (pKa 4.74 ± 1)" label still crosses the red equivalence line at 25 mL, because the label is right-aligned and wider than the space right of the line. On narrow screens, place it at the left end of the band (below the indicator label), or shorten it to "buffer pKa ± 1". It must not overlap the equivalence line, the indicator label or the data.
-
Desktop intro "how to use" list (regression from round 16). At 1440 px, steps 1 and 2 now share one line: "① Set up analyte, concentration, titrant, indicator. ② Titrate add drops (or drag the stopcock) and watch the flask and curve." Steps 3 and 4 are each on their own line. The list items flow inline. On desktop (wider than 720 px), each of the four steps must be on its own line: badge, bold label, then the description on the same line, with a clear gap (about 8 px) between the bold label and the description. Keep the phone layout from round 16 (badge + label on one line, description below) exactly as it is.
-
Phone main curve label (390 px). "buffer pKa 4.74 ± 1" is drawn inside the plot at the left end of the buffer band. With acetic acid the teal data curve runs straight through the text at pH ≈ 4.5. On narrow screens (below 720 px), do not draw the buffer-region label or the indicator-band label inside the plot. Add them to the legend above the chart instead: one legend entry with a small violet swatch for "buffer region (pKa 4.74 ± 1)", and one with a pink gradient swatch for "Phenolphthalein 8.0–10.0" (use the current indicator). The shaded bands stay in the plot. Desktop keeps its in-plot labels unchanged.
1 build 21.3 min · 10 files changed, 5468 insertions(+), 3 deletions(-) Show prompt
Read AGENTS.md, SPEC.md and BRAND.md in this directory. Then build the complete app they describe, step by step: first write a script in scripts/ that turns the constants transcribed in data/raw/SOURCES.md (Ka/Kb/Kw values, indicator pH ranges and colors, and the Table 14.2 reference titration data, with their OpenStax citations and links) into compact JSON in data/embed/ and run it (data/raw/ contains only SOURCES.md — use the numbers in its tables; do not download anything); then write src/body.html, src/app.css and src/app.js; run python3 build.py --check and fix any error it reports. Implement every required feature in SPEC.md with a polished, modern, responsive University of Idaho design. Do not stop until python3 build.py --check succeeds and every feature is implemented.
2 feedback 24.3 min · 8 files changed, 1606 insertions(+), 808 deletions(-) Show prompt
Read FEEDBACK.md in this directory — it lists problems a reviewer found when testing index.html in a real browser. Fix every item, keeping everything that already works, then run python3 build.py --check.
Reviewer feedback — round 1 build (tested in Chromium at 1440×900 and 390×844)
Most important first. The layout, brand look, the sources panel and the HCl curve are good, so keep them. But the core chemistry and two of the four modes do not work yet.
3 feedback 37.0 min · 3 files changed, 91 insertions(+), 64 deletions(-) Show prompt
Read FEEDBACK.md in this directory — it lists problems a reviewer found when testing index.html in a real browser. Fix every item, keeping everything that already works, then run python3 build.py --check.
Reviewer feedback — round 2 build (tested in Chromium at 1440×900 and 390×844)
But the page now crashes on load, and the pH math is still wrong everywhere except after the equivalence point. Fix items 1 and 2 first, test them, then continue with the rest.
| Case | App gives | Correct (Table 14.2 / exact charge balance) |
|---|---|---|
| 0.100 M acetic acid, 0 mL NaOH | 1.93 | 2.87 |
| acetic, 5 / 12.5 / 20 / 24.9 / 25 / 30 mL | 0.00 at every volume | 4.14 / 4.74 / 5.35 / 7.14 / 8.72 / 11.96 |
| 0.100 M HCl, 0 mL | 7.00 | 1.00 |
| HCl, 5 / 24.9 / 25 / 25.1 mL | 0.00 | 1.18 / 3.70 / 7.00 / 10.30 |
| phosphoric, 0 / 12.5 / 25 / 37.5 / 50 / 60 mL | 1.19 then 0.00 | 1.62 / 2.27 / 4.70 / 7.21 / 9.68 / 11.77 |
| carbonic, 0 / 25 / 50 mL | 2.46 then 0.00 | 3.68 / 8.35 / 11.41 |
| ammonia analyte with 0.100 M HCl, 0 / 12.5 / 25 mL | (check) | 11.13 / 9.26 / 5.28 |
| Buffer builder: 0.10 M acetic + 0.10 M acetate, 100 mL | 3.201 | 4.745 (H–H 4.745) |
4 continue 27.1 min · 3 files changed, 101 insertions(+), 148 deletions(-) Show prompt
Read FEEDBACK.md in this directory — it lists problems a reviewer found when testing index.html in a real browser. Fix every item, keeping everything that already works, then run python3 build.py --check.
Reviewer feedback — round 2 build (tested in Chromium at 1440×900 and 390×844)
But the page now crashes on load, and the pH math is still wrong everywhere except after the equivalence point. Fix items 1 and 2 first, test them, then continue with the rest.
| Case | App gives | Correct (Table 14.2 / exact charge balance) |
|---|---|---|
| 0.100 M acetic acid, 0 mL NaOH | 1.93 | 2.87 |
| acetic, 5 / 12.5 / 20 / 24.9 / 25 / 30 mL | 0.00 at every volume | 4.14 / 4.74 / 5.35 / 7.14 / 8.72 / 11.96 |
| 0.100 M HCl, 0 mL | 7.00 | 1.00 |
| HCl, 5 / 24.9 / 25 / 25.1 mL | 0.00 | 1.18 / 3.70 / 7.00 / 10.30 |
| phosphoric, 0 / 12.5 / 25 / 37.5 / 50 / 60 mL | 1.19 then 0.00 | 1.62 / 2.27 / 4.70 / 7.21 / 9.68 / 11.77 |
| carbonic, 0 / 25 / 50 mL | 2.46 then 0.00 | 3.68 / 8.35 / 11.41 |
| ammonia analyte with 0.100 M HCl, 0 / 12.5 / 25 mL | (check) | 11.13 / 9.26 / 5.28 |
| Buffer builder: 0.10 M acetic + 0.10 M acetate, 100 mL | 3.201 | 4.745 (H–H 4.745) |
5 feedback 8.9 min · 6 files changed, 554 insertions(+), 233 deletions(-) Show prompt
Read FEEDBACK.md in this directory — it lists problems a reviewer found when testing index.html in a real browser. Fix every item, keeping everything that already works, then run python3 build.py --check.
Reviewer feedback — round 4 build (tested in Chromium at 1440×900 and 390×844)
Previous rounds ran out of steps writing throwaway Python simulations. Please fix the JavaScript directly using the diagnosis below. Then confirm the fix with that self-check table (target: max deviation below 0.05 away from exactly 25.00 mL) and with scripts/check_solver.py.
| Buffer | App shows | Expected pH | H–H |
|---|---|---|---|
| 0.10 M acid + 0.10 M base | 7.000 | 4.745 | 4.745 |
| 0.10 M acid + 0.30 M base | 13.301 | 5.22 | 5.222 |
| 0.10 + 0.30 M, plus 5 mL of 1.00 M NaOH | 13.477 | ≈ 5.59 | 5.590 |
6 feedback 14.9 min · 4 files changed, 621 insertions(+), 363 deletions(-) Show prompt
Read FEEDBACK.md in this directory — it lists problems a reviewer found when testing index.html in a real browser. Fix every item, keeping everything that already works, then run python3 build.py --check.
Reviewer feedback — round 5 build (tested in Chromium at 1440×900 and 390×844)
Remaining problems, most important first:
7 feedback 7.9 min · 5 files changed, 368 insertions(+), 125 deletions(-) Show prompt
Read FEEDBACK.md in this directory — it lists problems a reviewer found when testing index.html in a real browser. Fix every item, keeping everything that already works, then run python3 build.py --check.
Reviewer feedback — round 6 build (tested in Chromium at 1440×900 and 390×844)
Remaining problems, most important first:
8 feedback 1.8 min · 3 files changed, 78 insertions(+), 54 deletions(-) Show prompt
Read FEEDBACK.md in this directory — it lists problems a reviewer found when testing index.html in a real browser. Fix every item, keeping everything that already works, then run python3 build.py --check.
Reviewer feedback — round 7 build (tested in Chromium at 1440×900 and 390×844)
Only three problems remain, most important first:
9 feedback 1.2 min · 3 files changed, 97 insertions(+), 82 deletions(-) Show prompt
Read FEEDBACK.md in this directory — it lists problems a reviewer found when testing index.html in a real browser. Fix every item, keeping everything that already works, then run python3 build.py --check.
Reviewer feedback — round 8 build (tested in Chromium at 1440×900 and 390×844)
Keep all of that. Only one problem remains, and it affects every chart.
10 feedback 0.7 min · 3 files changed, 37 insertions(+), 28 deletions(-) Show prompt
Read FEEDBACK.md in this directory — it lists problems a reviewer found when testing index.html in a real browser. Fix every item, keeping everything that already works, then run python3 build.py --check.
Reviewer feedback — round 9 build (tested in Chromium at 1440×900 and 390×844)
Everything else still works and must be kept: solver, endpoints, strong acid/base cards, buffer builder, challenge scoring, notebook/CSV, phone layout, and a clean console. The chart-alignment problem from last round is still visible in the browser. The new axisRange() helper is only half applied.
11 critic 7.0 min · 7 files changed, 1188 insertions(+), 398 deletions(-) Show prompt
Read FEEDBACK.md in this directory — it lists problems a reviewer found when testing index.html in a real browser. Fix every item, keeping everything that already works (the pH solver, endpoint detection and chart axes are correct — do not change the chemistry), then run python3 build.py --check.
Reviewer feedback (critic pass 1) — fix every item, then run python3 build.py --check
The charge-balance solver, endpoint detection and chart axes are CORRECT now. Every pH I checked matches an independent calculation. Do not change the chemistry in titrationPH / solvePH / chargeResidual, and do not break the 390 px phone layout (no horizontal overflow) or introduce console errors.
Items are in priority order.
1. Burette drawing is geometrically wrong (bench #stand-svg and challenge #ch-flask-svg)
2. Buffer builder is wrong when strong acid or base is in excess
Cause: in renderBuffer(), spAfter rebuilds the species without r.nClLeft (it passes strongAcid = 0) and without r.nNaLeft. Build spAfter from the same totals as bufferSpecies() plus the extra 0.001 mol NaOH (and the extra 1 mL of volume). The n/a message must say "strong acid in excess" or "strong base in excess", whichever is true.
3. Indicators with two color changes only have their first range
The app ignores them. With thymol blue at pH 12 the flask is yellow (it should be blue), and the dropdown reads "Thymol blue (1.2–2.8)".
4. Changing "Drop size" wipes the titration
After 5 drops (0.50 mL), changing Drop size to 0.05 resets to 0.00 mL ("Fresh flask"). Drop size is not chemistry, so it must NOT call resetBench(). Only analyte, titrant, concentration and volume changes should reset.
5. Event-listener leak on the charts (hover gets slower the longer the page is used)
attachChartTooltip() runs on every redraw of #chart-curve, #chart-d1 and #chart-d2. Each call adds mousemove, mouseleave, touchstart, touchmove and touchend listeners, but clearSvg() only removes children. Measured after one auto-titration: #chart-curve had 274 mousemove listeners, growing by one per drop with no limit.
Fix: attach the listeners ONCE per svg. Store the latest getTip function and tooltip nodes on the svg (e.g. svg._getTip), have the single permanent listener use them, and re-create the tooltip group at the end of each draw.
6. The unknown challenge cannot really be solved, and it is tedious
7. Numeric inputs accept nonsense
Fix: clamp or validate every numeric input (bench, buffer, challenge) to its min/max. Show a short inline message under a field with an invalid value, and never compute with a value different from what the field shows.
8. Buffer capacity chart: the interesting part is a tiny bump
The y-axis goes to 1.2 because [H⁺] + [OH⁻] explode at pH 0 and 14, so the buffer peak at pKa (β ≈ 0.115) is a barely visible bump. That makes the caption "The peak sits at pH = pKa" hard to believe.
9. Derivative charts are small and letterboxed
On desktop the first- and second-derivative plots fill only about half their card width, and tick labels render at about 7–8 px. Make these SVGs fill the card width (a viewBox close to the card's aspect ratio, e.g. 600×260) with on-screen tick labels of at least 11 px. Do the same for the challenge mini charts.
10. Layout polish of the first screen and the bench card
11. Small polish
12 critic 3.4 min · 5 files changed, 264 insertions(+), 239 deletions(-) Show prompt
Read FEEDBACK.md in this directory — it lists the few remaining problems a reviewer found when testing index.html in a real browser. Fix every item, keeping everything that already works (the pH solver, endpoint detection, chart axes, challenge and notebook are correct — do not change them), then run python3 build.py --check.
Reviewer feedback (critic pass 2) — fix every item, then run python3 build.py --check
Keep all of that. Do not change the chemistry, the chart axes, the challenge scoring or the notebook. Only these remaining items:
1. The burette tip and stopcock are still INSIDE the flask (bench #stand-svg and challenge #ch-flask-svg)
So the lower 6 mL of the burette scale (the 40–50 labels), the stopcock with its yellow handle, and the tip are all drawn inside the flask neck and body. When the flask fills, the stopcock is hidden behind the liquid.
2. Bench card: large empty area, controls wrap, readout values wrap
3. The bench status line shows stale numbers
On the phone, after 8 drops (0.80 mL, pH 3.33) the status line under the bench still said "Titrant added: 0.00 mL — pH –". flashStatus() writes a snapshot after 4 s, and later drops or stopcock flow never refresh it. Update the status text in addVolume() on every drop, unless a flash message is currently showing. In that case, write the live values when the flash timer ends.
4. Phone titration chart: labels collide
At 390 px the "buffer region (pKa 4.74 ± 1)" label overlaps the first data points and the indicator band label. On narrow screens, put the buffer-region label at the right end of its band (text-anchor end, x = plot right − 6), and keep the indicator label at the left.
13 critic 0.5 min · 4 files changed, 37 insertions(+), 63 deletions(-) Show prompt
Read FEEDBACK.md in this directory — it lists three small problems a reviewer found when testing index.html in a real browser. Fix exactly those three items and change nothing else, then run python3 build.py --check.
Reviewer feedback (critic pass 3) — three small fixes, then run python3 build.py --check
Change NOTHING else. Only fix these three items:
1. JavaScript error on every challenge drop (regression from round 12)
challengeRipple() in src/app.js uses start inside step(), but the line const start = performance.now(); is missing. The bench version rippleFlask() has it. Every "Add drop / Add 10 drops / Add 1 mL / Add 5 mL" click in the Unknown challenge logs Uncaught ReferenceError: start is not defined. Fix: add const start = performance.now(); right before const step = ... in challengeRipple().
2. Phone (390 px): stopcock label is cut off and the page scrolls sideways by 1 px
On the Titration bench tab at 390×844, the label "STOPCOCK (FLOW RATE: CLOSED → DROPWISE → OPEN)" is clipped at "→ OPE", and document.documentElement.scrollWidth is 1 px wider than the window. Cause: .burette-controls .slider-label has flex: 0 0 auto in a wrapping flex row, so the long label can't shrink or wrap. Fix: in the phone media query, give .burette-controls .slider-label flex: 1 1 100%; white-space: normal; and give the range input flex: 1 1 100%. On desktop, allow the label to shrink too (min-width: 0). Also add min-width: 0 to .bench-stage > *, so no child can force horizontal overflow.
3. Desktop: the Analyte fact pill wraps
In the Bench card at 1440 px, "Analyte CH₃CO₂H · 0.100 M · 25.00 mL" wraps to a second line ("mL" on its own). Keep the value on one line: .fact__val { white-space: nowrap; } with a slightly smaller font (e.g. .8rem) for the fact pills.
14 feedback 1.8 min · 10 files changed, 328 insertions(+), 375 deletions(-) Show prompt
Read FEEDBACK.md in this directory — it lists changes the project owner decided on and problems a reviewer found when testing index.html in a real browser. Make every change, keeping everything that already works, then run python3 build.py --check.
FEEDBACK — OpenStax data decision (project owner, 2026-09-13)
1. Remove Table 14.2 everywhere (highest priority)
2. Replace the old panel with an independent solver check
In the Data & sources panel, where the Table 14.2 section was, add a section titled "Solver check: strong acid–strong base (hand-calculable)".
Reviewer's own calculation. For each volume: d = (n_HCl − n_NaOH) / V_total, [H⁺] = (d + √(d² + 4 Kw)) / 2, pH = −log₁₀[H⁺].
| NaOH added (mL) | Total volume (mL) | [H⁺] − [OH⁻] (M) | Reference pH |
|---|---|---|---|
| 0.00 | 25.00 | +1.0000e-01 | 1.000 |
| 6.25 | 31.25 | +6.0000e-02 | 1.222 |
| 12.50 | 37.50 | +3.3333e-02 | 1.477 |
| 18.75 | 43.75 | +1.4286e-02 | 1.845 |
| 23.00 | 48.00 | +4.1667e-03 | 2.380 |
| 24.75 | 49.75 | +5.0251e-04 | 3.299 |
| 24.95 | 49.95 | +1.0010e-04 | 4.000 |
| 25.00 | 50.00 | +0.0000e+00 | 7.000 |
| 25.05 | 50.05 | -9.9900e-05 | 10.000 |
| 26.50 | 51.50 | -2.9126e-03 | 11.464 |
| 31.25 | 56.25 | -1.1111e-02 | 12.046 |
| 37.50 | 62.50 | -2.0000e-02 | 12.301 |
| 50.00 | 75.00 | -3.3333e-02 | 12.523 |
The app's current solver already matches all 13 values to better than 0.001. Leave the solver alone.
3. scripts/check_solver.py: no more book values
4. Credit wording and the CC BY-NC-SA 4.0 attribution
Replace the intro paragraph of the Data & sources panel with wording that says exactly what is used. For example:
Ka, Kb and Kw values and indicator color-change pH ranges are transcribed from **OpenStax, Chemistry 2e by Paul Flowers, Klaus Theopold, Richard Langley and William R. Robinson (2019): Appendices H and I and Sections 14.1 and 14.7. Licensed under CC BY-NC-SA 4.0** (link to https://creativecommons.org/licenses/by-nc-sa/4.0/). Access for free at https://openstax.org/books/chemistry-2e/pages/1-introduction (link). Changes: only numeric values were transcribed into this app's own tables; no text, tables, figures or images from the book are reproduced. OpenStax does not endorse this app.
5. Finish
Run python3 scripts/make_data.py, then python3 scripts/check_solver.py, then python3 build.py --check. All three must succeed. Before you finish, confirm that data/embed/ contains only constants.json, indicators.json and solver_check.json.
15 critic 14.6 min · 5 files changed, 237 insertions(+), 92 deletions(-) Show prompt
Read FEEDBACK.md in this directory — it lists problems a reviewer found when testing index.html in a real browser, with exact repro steps and expected values. Fix every item, keeping everything that already works (solver, solver-check table, endpoint detection, challenge, notebook, CSV, sources credit). Then run python3 build.py --check and python3 scripts/check_solver.py.
Reviewer feedback (critic re-review, 2026-09-13)
I tested index.html in Chromium at 1440×900 and 390×844. The solver is accurate: I matched 12 pH values against an independent charge-balance solver to 0.001, and the solver-check table matches. Fix the items below in priority order. Keep everything that works. That means the 13-row solver-check table (Δ 0.000), phosphoric auto-titration endpoints 25.00 / 50.00 mL, 0 console errors, 0 external requests and no horizontal overflow at 390 px. Do not add any OpenStax table, figure or worked-example data. The only OpenStax data allowed are the Ka/Kb/Kw values and indicator ranges already in data/embed/.
Correctness
Interaction
Visual polish
When done, run python3 build.py --check, and also python3 scripts/check_solver.py (it must still print FAILURES: 0).
16 critic 2.2 min · 5 files changed, 146 insertions(+), 151 deletions(-) Show prompt
Read FEEDBACK.md in this directory — it lists six remaining layout problems (some are regressions from the last round) that a reviewer found in a real browser. Fix every item with small, targeted CSS/markup/JS changes; do not change the chemistry, solver, solver-check table or sources text, and keep every earlier fix. Then run python3 build.py --check and python3 scripts/check_solver.py.
Reviewer feedback: follow-up after round 15 (2026-09-13)
Do not change the chemistry, the solver, the solver-check table or the Data & sources text. Only the layout items below are left. Several are new regressions from round 15. Keep every fix from round 15.
Then run python3 build.py --check and python3 scripts/check_solver.py (it must still print FAILURES: 0).
17 critic 1.0 min · 3 files changed, 60 insertions(+), 32 deletions(-) Show prompt
Read FEEDBACK.md in this directory — it lists two small layout problems a reviewer found in a real browser (one is a regression from the last round). Fix both with small, targeted CSS/markup/JS changes, change nothing else, and keep every earlier fix. Then run python3 build.py --check and python3 scripts/check_solver.py.
Reviewer feedback: two small layout fixes after round 16 (2026-09-13)
Round 16 fixed the six layout items (I checked them in a browser). Two layout problems remain, one of them a regression. Change only what these two items need. Do not touch the chemistry, solver, readouts, notebook, challenge, buffer builder or sources text, and keep every earlier fix: select labels, burette labels, stacked fact tiles, bench readout position, buffer card fields, phone how-to layout.
Then run python3 build.py --check and python3 scripts/check_solver.py (it must still print FAILURES: 0).
What the agent was asked
The full specification the harness received, rendered from the original Markdown.
Known limitations
Reported by the independent critic. ✎ written by the AI critic
- Carbonic acid's weak second equivalence (50 mL) is marked from stoichiometry but is not reported by the 2nd-derivative endpoint detector.
- Desktop: for two-transition indicators such as thymol blue, the in-plot band label (e.g. 'Thymol blue 1.2-2.8') can sit on the data curve when the analyte starts near pH 2.
- Stopcock flow at the mid setting is slow (0.14 mL/s); auto-titration takes about 15 s for a monoprotic acid and 29 s for phosphoric acid, and auto runs write many notebook rows (grouped and collapsible).
- The challenge 'Submit answer' button is enabled before any drops are added (blank answers are blocked with an inline message).
- Phone: the tab strip scrolls horizontally with no visual cue that more tabs are off-screen.
- Judgement call kept: the Data & sources hint describes the methyl orange alt text on the OpenStax page as a 'known transcription error' (commentary about the source, not book content).
- For a human: git history before round 14 still contains the removed Table 14.2 data, and the original OpenStax downloads remain in runs/titration-lab/provenance/ outside the project.